
Optimizations verses Functionality
An expert recently said to me that the most important optimizations of systems need to be identified at the appropriate time. Trying to identify and create them too early can affect the design of the system, negatively impacting functionality and flexibility. In other words, the optimization can become more important than the functionality, compromising the over results of the system design.
I thought this was an interesting point.
He also, to his credit, noted he was not an expert on data per se; tending to deal much more with transaction processing systems and the optimization of them, although clearly with enough experience with reporting systems to understand and make recommendations about them.
Having focused very much on data for my career, his comment made me wonder how might I express the nature of the critical functionality of a data centric reporting and analytical system, independent of the optimizations I have seen driven over the years.
Let’s see if this is helpful.
Record Keeping, or perhaps Data Keeping
Record keeping is a very expensive task. The overhead on any organization to record, track, and report on transactions is a significant cost when attempting to provide goods or services at the lowest possible price. Customers can easily understand a price set based upon the labor and materials that go into the specific product they purchase; they are less understanding of paying for the clerk to keep track of the company accounts and prepare the tax forms.
One of my mentors once explained how the process of recording data is very precious. To make it real, think of what you would have to do if your only available tool was a spreadsheet.
The process of opening a spreadsheet, and giving a name to a tab for the kinds of transactions you need to capture, i.e., sales, purchases, receipts, payments, does not take a lot of time at all.
The next step is deciding on the column headings for what needs to be recorded about each one of those types of transactions. If on average there are 10 things that could be recorded, then the cost of this task takes 10 times as long and is 10 times as expensive, at a minimum as naming the tabs.
Deciding the column names can take much longer than 10 times as long. But the costs continue to increase as next we have to decide what the possible values in each one of those columns are. What codes does one use to capture the legal entity, the cost centers, the accounts, the products, the currencies, the customers and vendors? If there are on average 50 values that could be recorded in each of the fields, then this again is 50 times as long as the last step.
But now, the most extraordinary cost of all begins, which is almost exponentially more expensive than the last step: for each transaction, someone, somewhere, has to pick those values for each column of the appropriate tab to record each individual transaction. The rows of data in the spreadsheet, the individuals sales, receipts, payments, shipments, commitments, time, materials, and resources accumulated over days, and weeks, and hopefully even years, is incredibly precious.
All of the work of defining what to record then stretches over long periods of time as those business events are recorded. I have noted through the years how valuable real, live, actual data is. As my friend, Dillon Papenfuss quoted me as saying:
“I have never seen system-generated data that has all the variability
of real, live production data. The differences are so stark it is a bit like the difference between a painting of a landscape, and a real, live landscape. The system-generated data is flat; it can give the single image it was intended to produce. But if one walks to the side of the painting, the image is not interesting at all. Whereas if one walks to a different point to view a landscape, it can be just as fascinating and interesting as the original perspective. And one can walk into the landscape, just as one can walk into real production data, and find all sorts of new things within it. System-generated data never has that kind of interest to it.”“Data: the Strategic Asset: November 2019” Financial Education & Research Foundation (FERF)
>>> Related Post: Simple Financial System Proof of Concept <<<
Transactions to Positions
The tactical use of record keeping, the follow-up on each row of data is critical to the functioning of business. As I have spoken about in the Bookkeeping Series, there is a flow of data through the accounts, as one transaction causes another transaction. A purchase causes a payment, a payment causes an expense, an expense causes a reduction in the profitability of the organization.
And so there is a very tactical use of the data recorded in the spreadsheet.
But Alfred W. Crosby didn’t say the magic of bookkeeping was this tactical use of the data. He said bookkeeping “taught us how to oblige grocery stores and nations, which are always whizzing about like hyperactive children, to stand still and be measured….” (Alfred W. Crosby, The Measure Of Reality: Quantification And Western Society, 1250-1600 (Cambridge University Press, 1997) Pages 201)
When we accumulate transactions over time, which creates something either termed a position or a balance, we create a perspective that can be very valuable. Almost all reporting processes begin with a balance. When one logs into a bank account, the first number of interest is the account balance, which is an accumulation of the transactions since the account was opened.
“What’s remaining in the budget?” “How many lines of code have been written?” How much time have you spent on that?” “How many customers have responded?”
All of these questions are usually answered by a balance; not by any one individual transaction.
Posting Systems
Balances, though, require a selection of a reduced set of attributes from what was recorded on the transaction. Each of those questions above deals with an attribute for some selected quantity for transactions, often by time. Monetary amounts, accumulation of lines of code, time spent on a task, numbers of customers.
There are some patterns of balances that are often asked for, and so we create systems that make these balances consistently. Bank accounts have them, and vendor and customer statements have them as well.
But these systems are usually quite fixed and static. The production of these balances is chosen when the system is designed, and once it is started, the system doesn’t produce any other balance but those that were chosen. It must be nurtured and cared for to make sure the balance does not deviate from the truth of the transactions, or else it may be perpetually incorrect from that time forward.
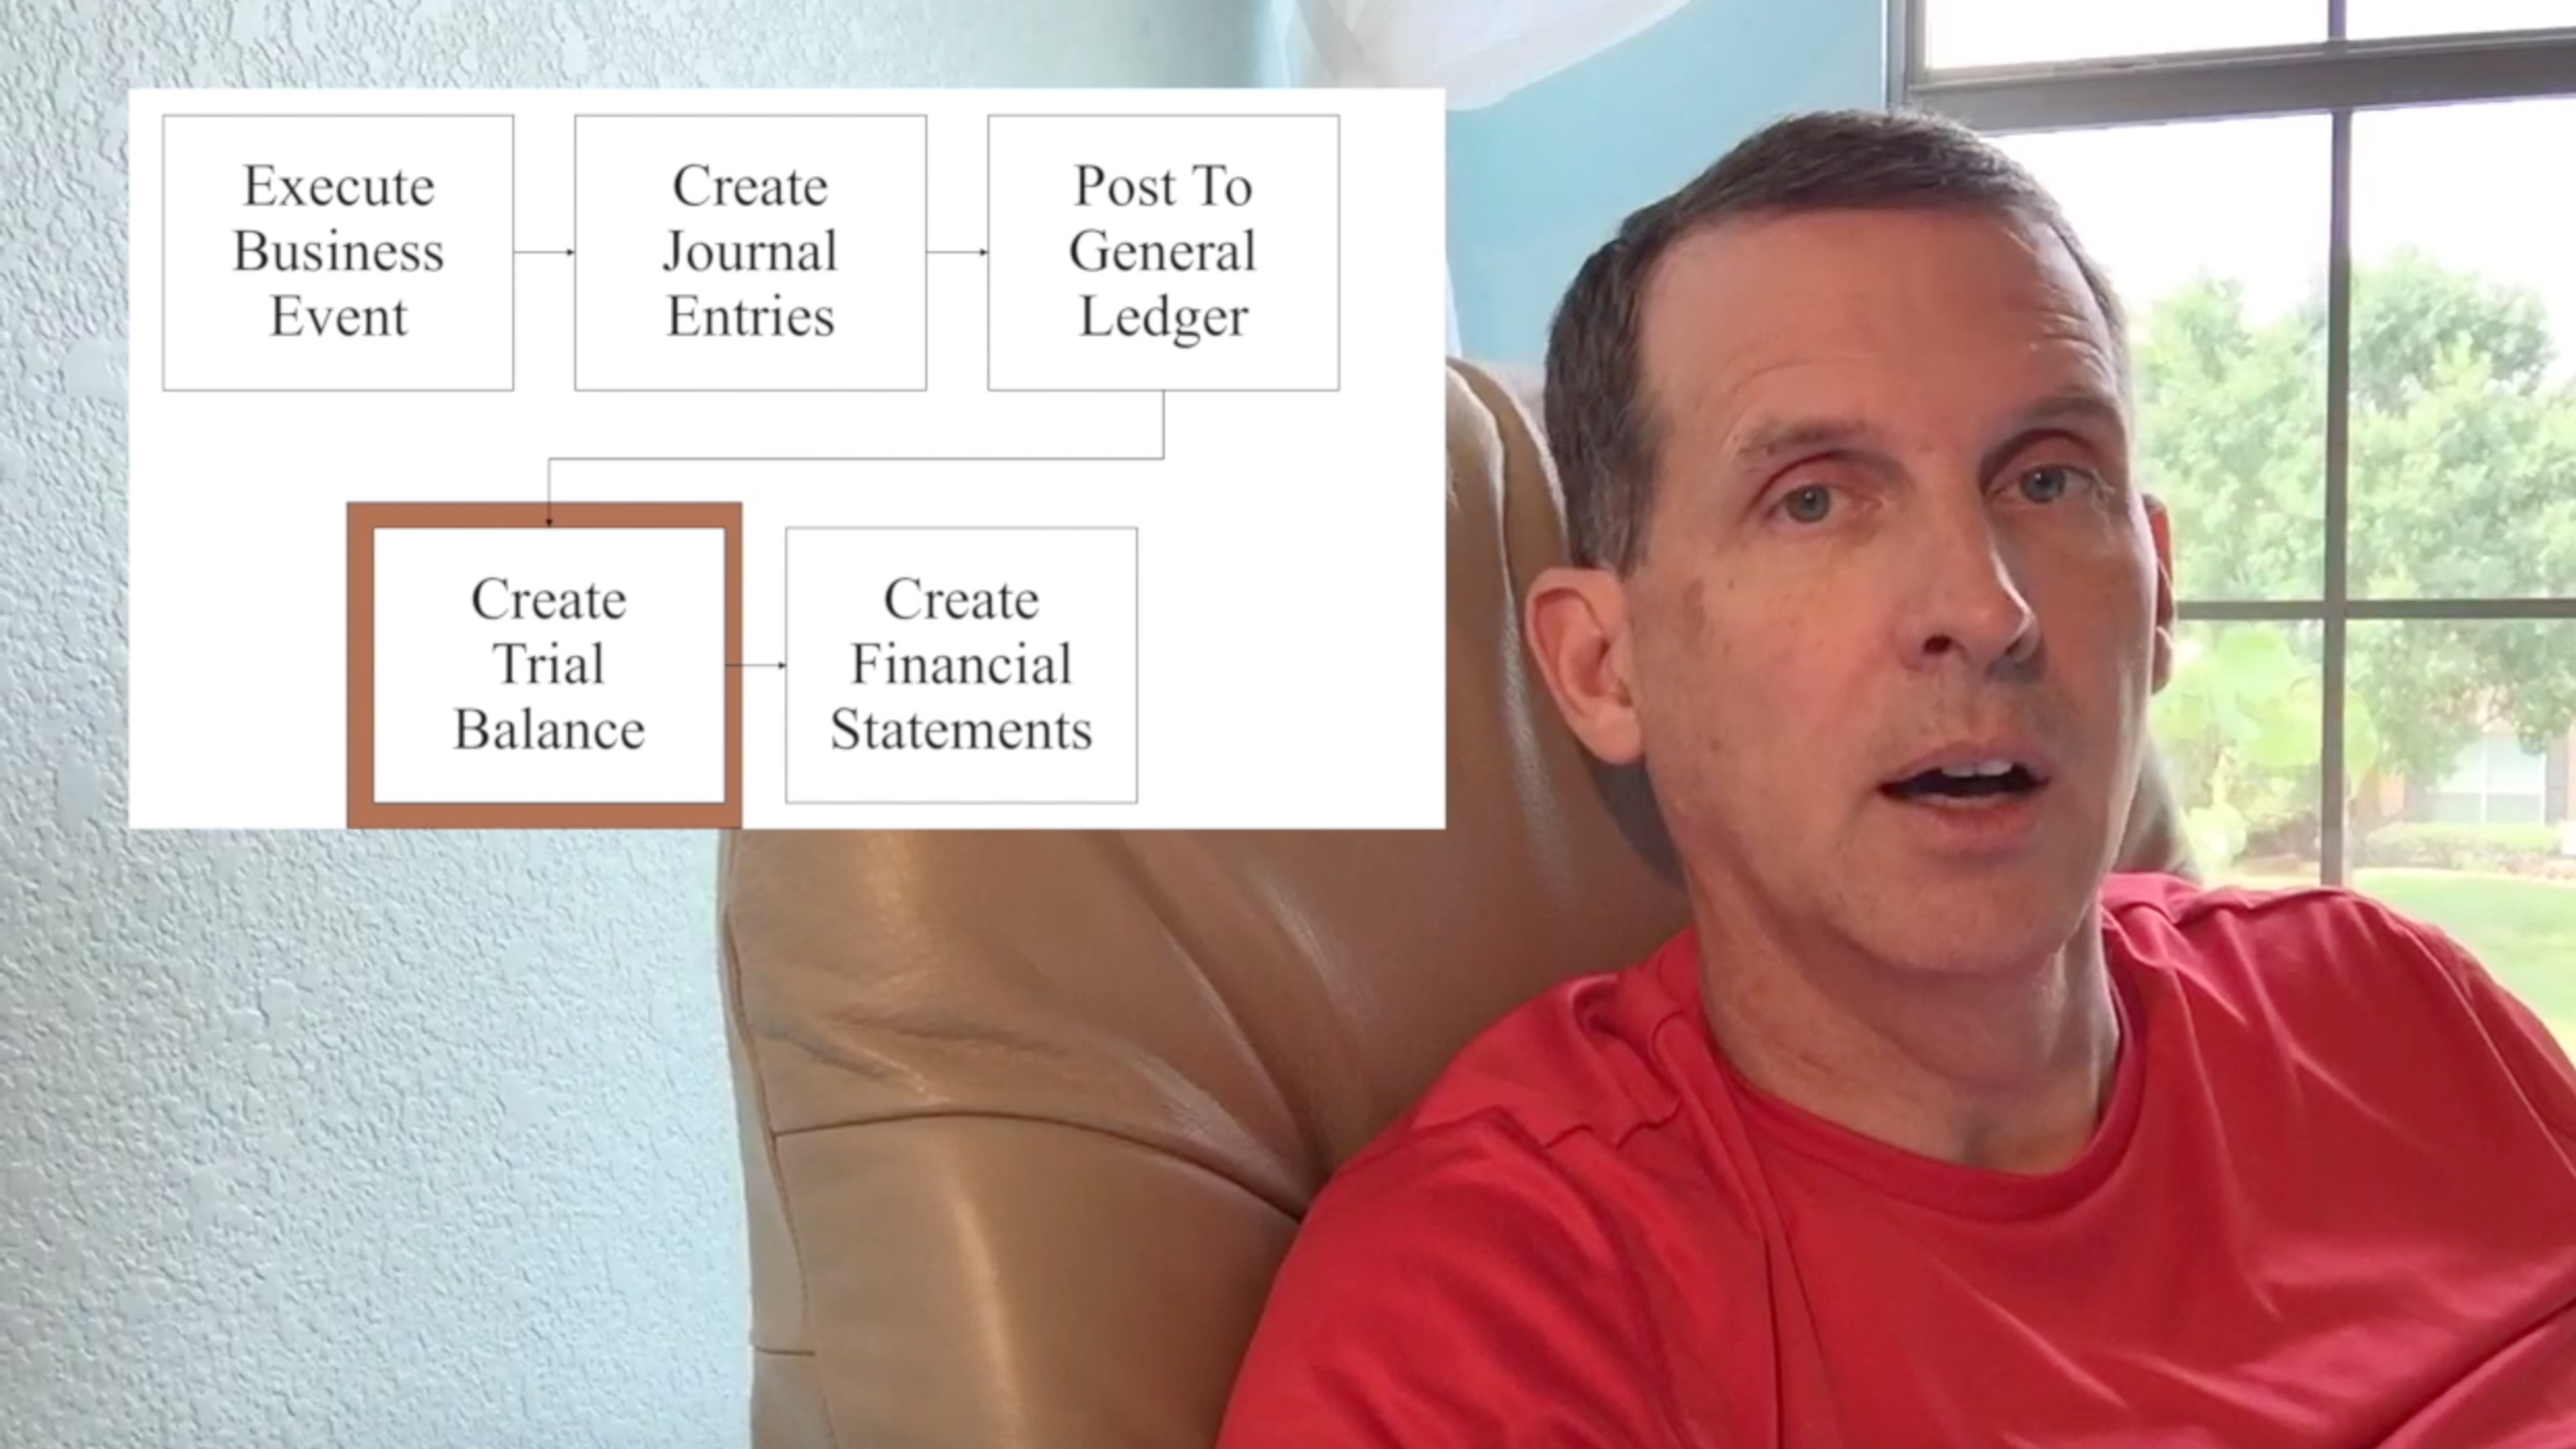
This process of creating balances consistently is called a posting process. The steps to do it were written down by Luca Pacioli in 1494 AD, are among the earliest business systems automated in the last century, and undergird every major business process in the world today.
>>> Related Post: Special Videos: A Cartoon about Business Systems <<<
Attribute Usability Over Time
So consider this difficult dilemma: We spend all this money and effort to capture all these attributes on the business events, and they are useful for the tactical work of getting paid and finishing the task at hand, and yet most all of them provide no benefit in the most powerful use of all–the perspective over time–because we’ve had to select a couple of them to be used in the posting process!
Huge costs; huge potential benefits; and for the most part completely unrealized.
This then is the functionality that is really wanted in analytical reporting systems. With the growth in computing capacities, we should be able to use nearly all the attributes we so painfully captured in analytical processes, to gain perspective and insights into what has happened, why it has happened, and how it relates to the rest of our business.
Volumes and Time and Industries
Certain industries are very sensitive to these issues. For example, insurance is a business of understanding trends in data over decades. One buys insurance for that once in a life time event: the major car accident, the destruction by fire of a home, or even death. Insurance companies look for trends, causes, risks, and analyze loss events over very long periods of time.
Being able to accumulate transactions efficiently over long periods of time, against trusted repositories (things which agree to the audit worthy book-of-record aggregate posted values) is the most important functionality desired in many businesses today.
So, having outlines some aspect of the most important functionality of the system, perhaps next we’ll talk about optimizations that might be made against such a system, and the technology landscape for tools in this space.


[…] the previous post, The Value of Data Part 1: Business Functionality I discussed the costly process of capturing attributes of business events, and the value in […]