The following slides have also appeared in my vlog. These slides are copyrighted. They are grouped by subjects.
- Quantitative Search Engines
- Data Supply Chains
- Daily Financial Cycle Graphs
- Consistency of Data Structures
- Customer Profitability
- Finance and Risk Data Integration
- System Architecture Views
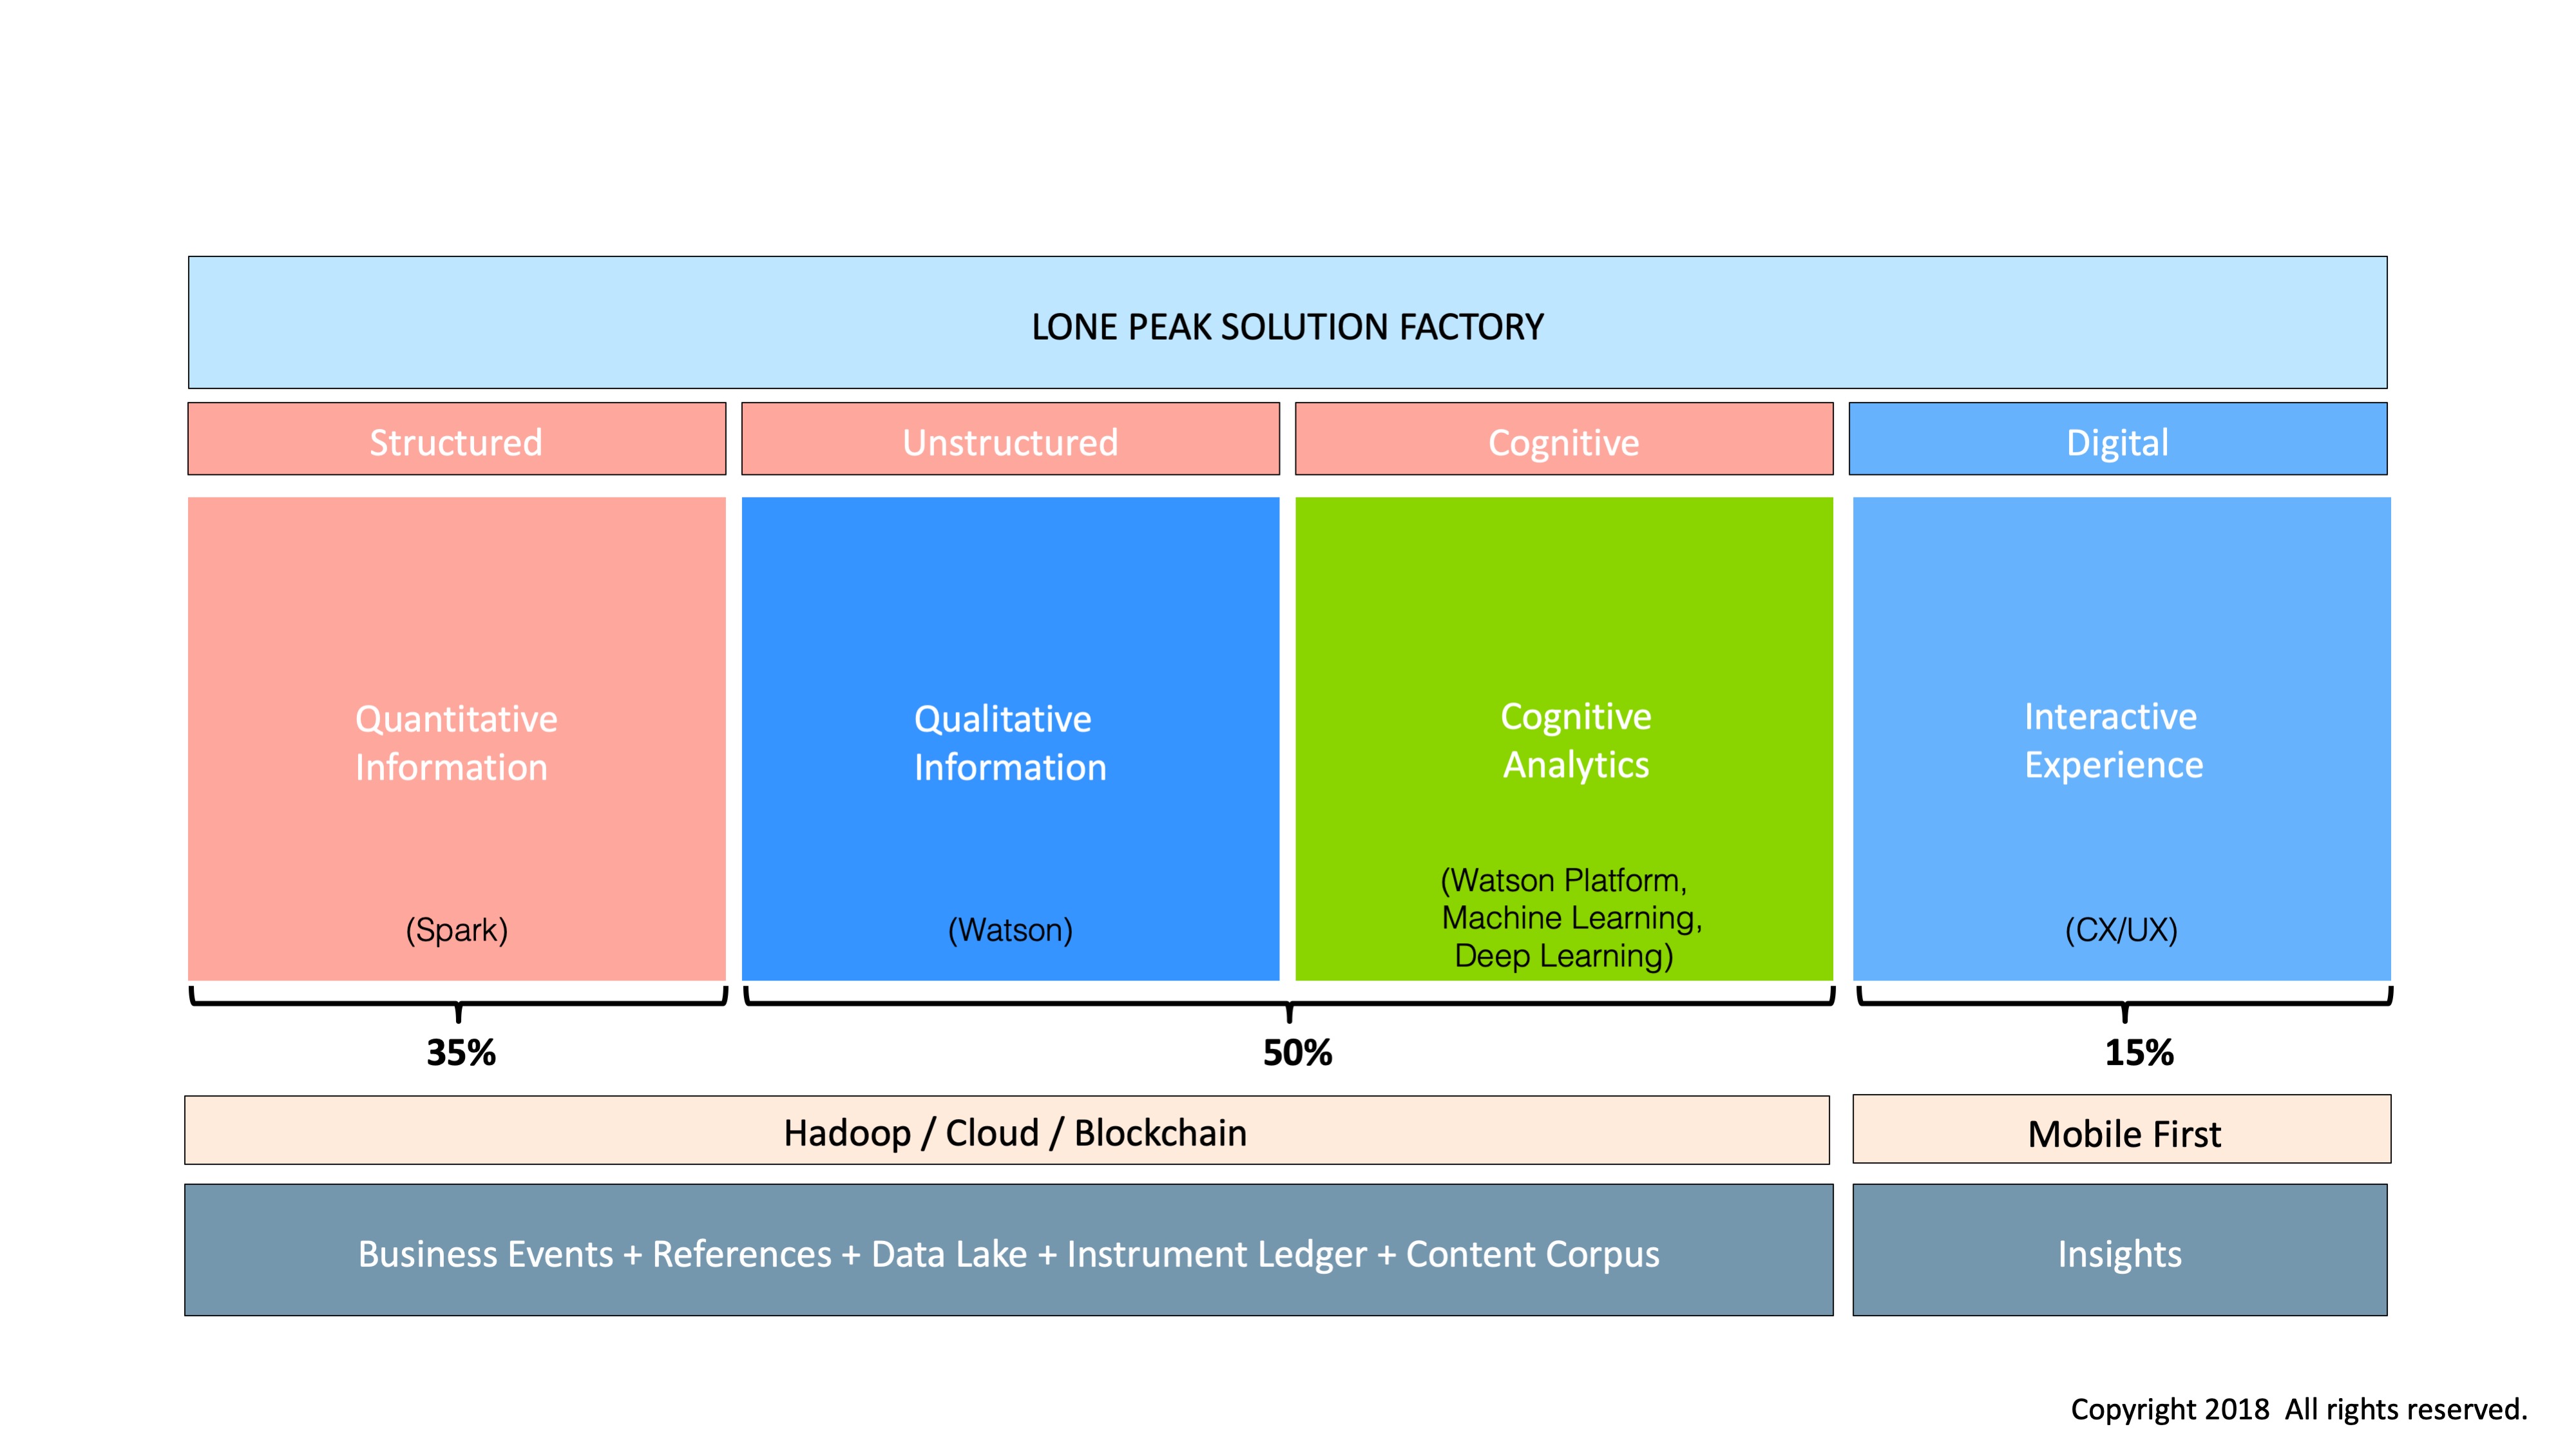
Quantitative Search Engines
Search engine usage is ubiquitous. But quantitative data is rarely used within them. This graphic highlights the different types of data in these two different domains, and the advances in one, with the static nature of technology in the other.

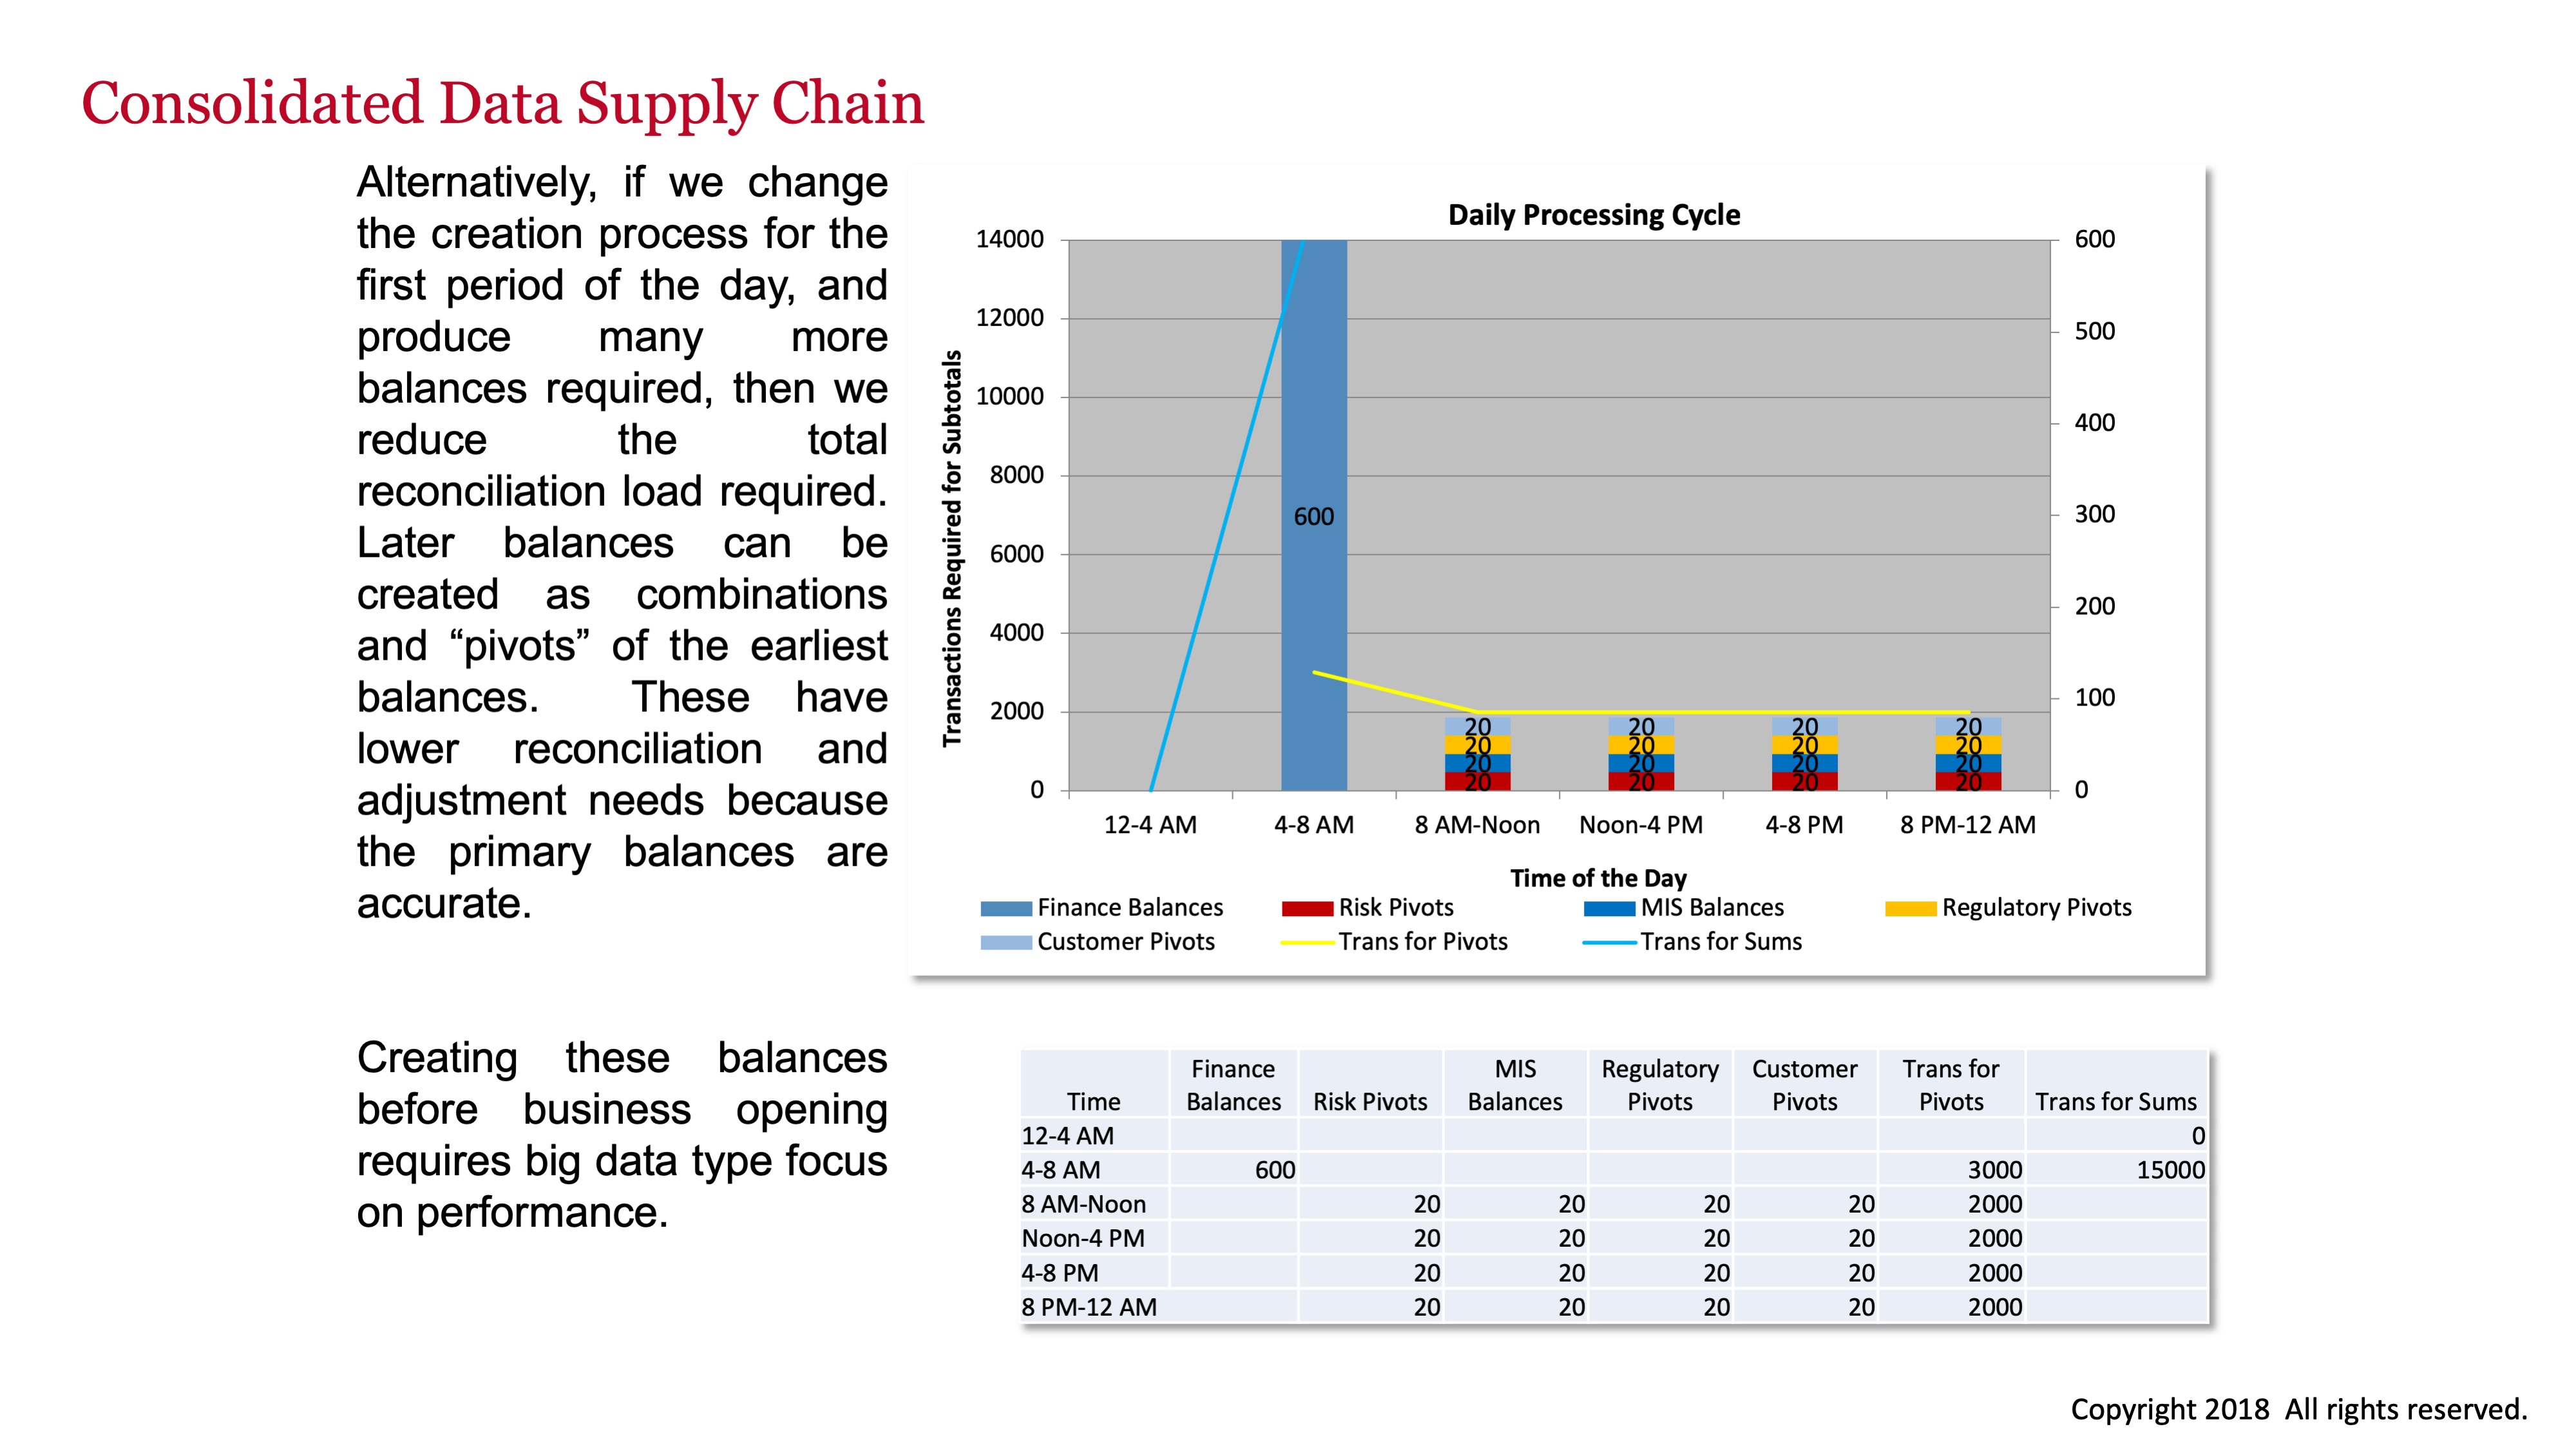
Data Supply Chains
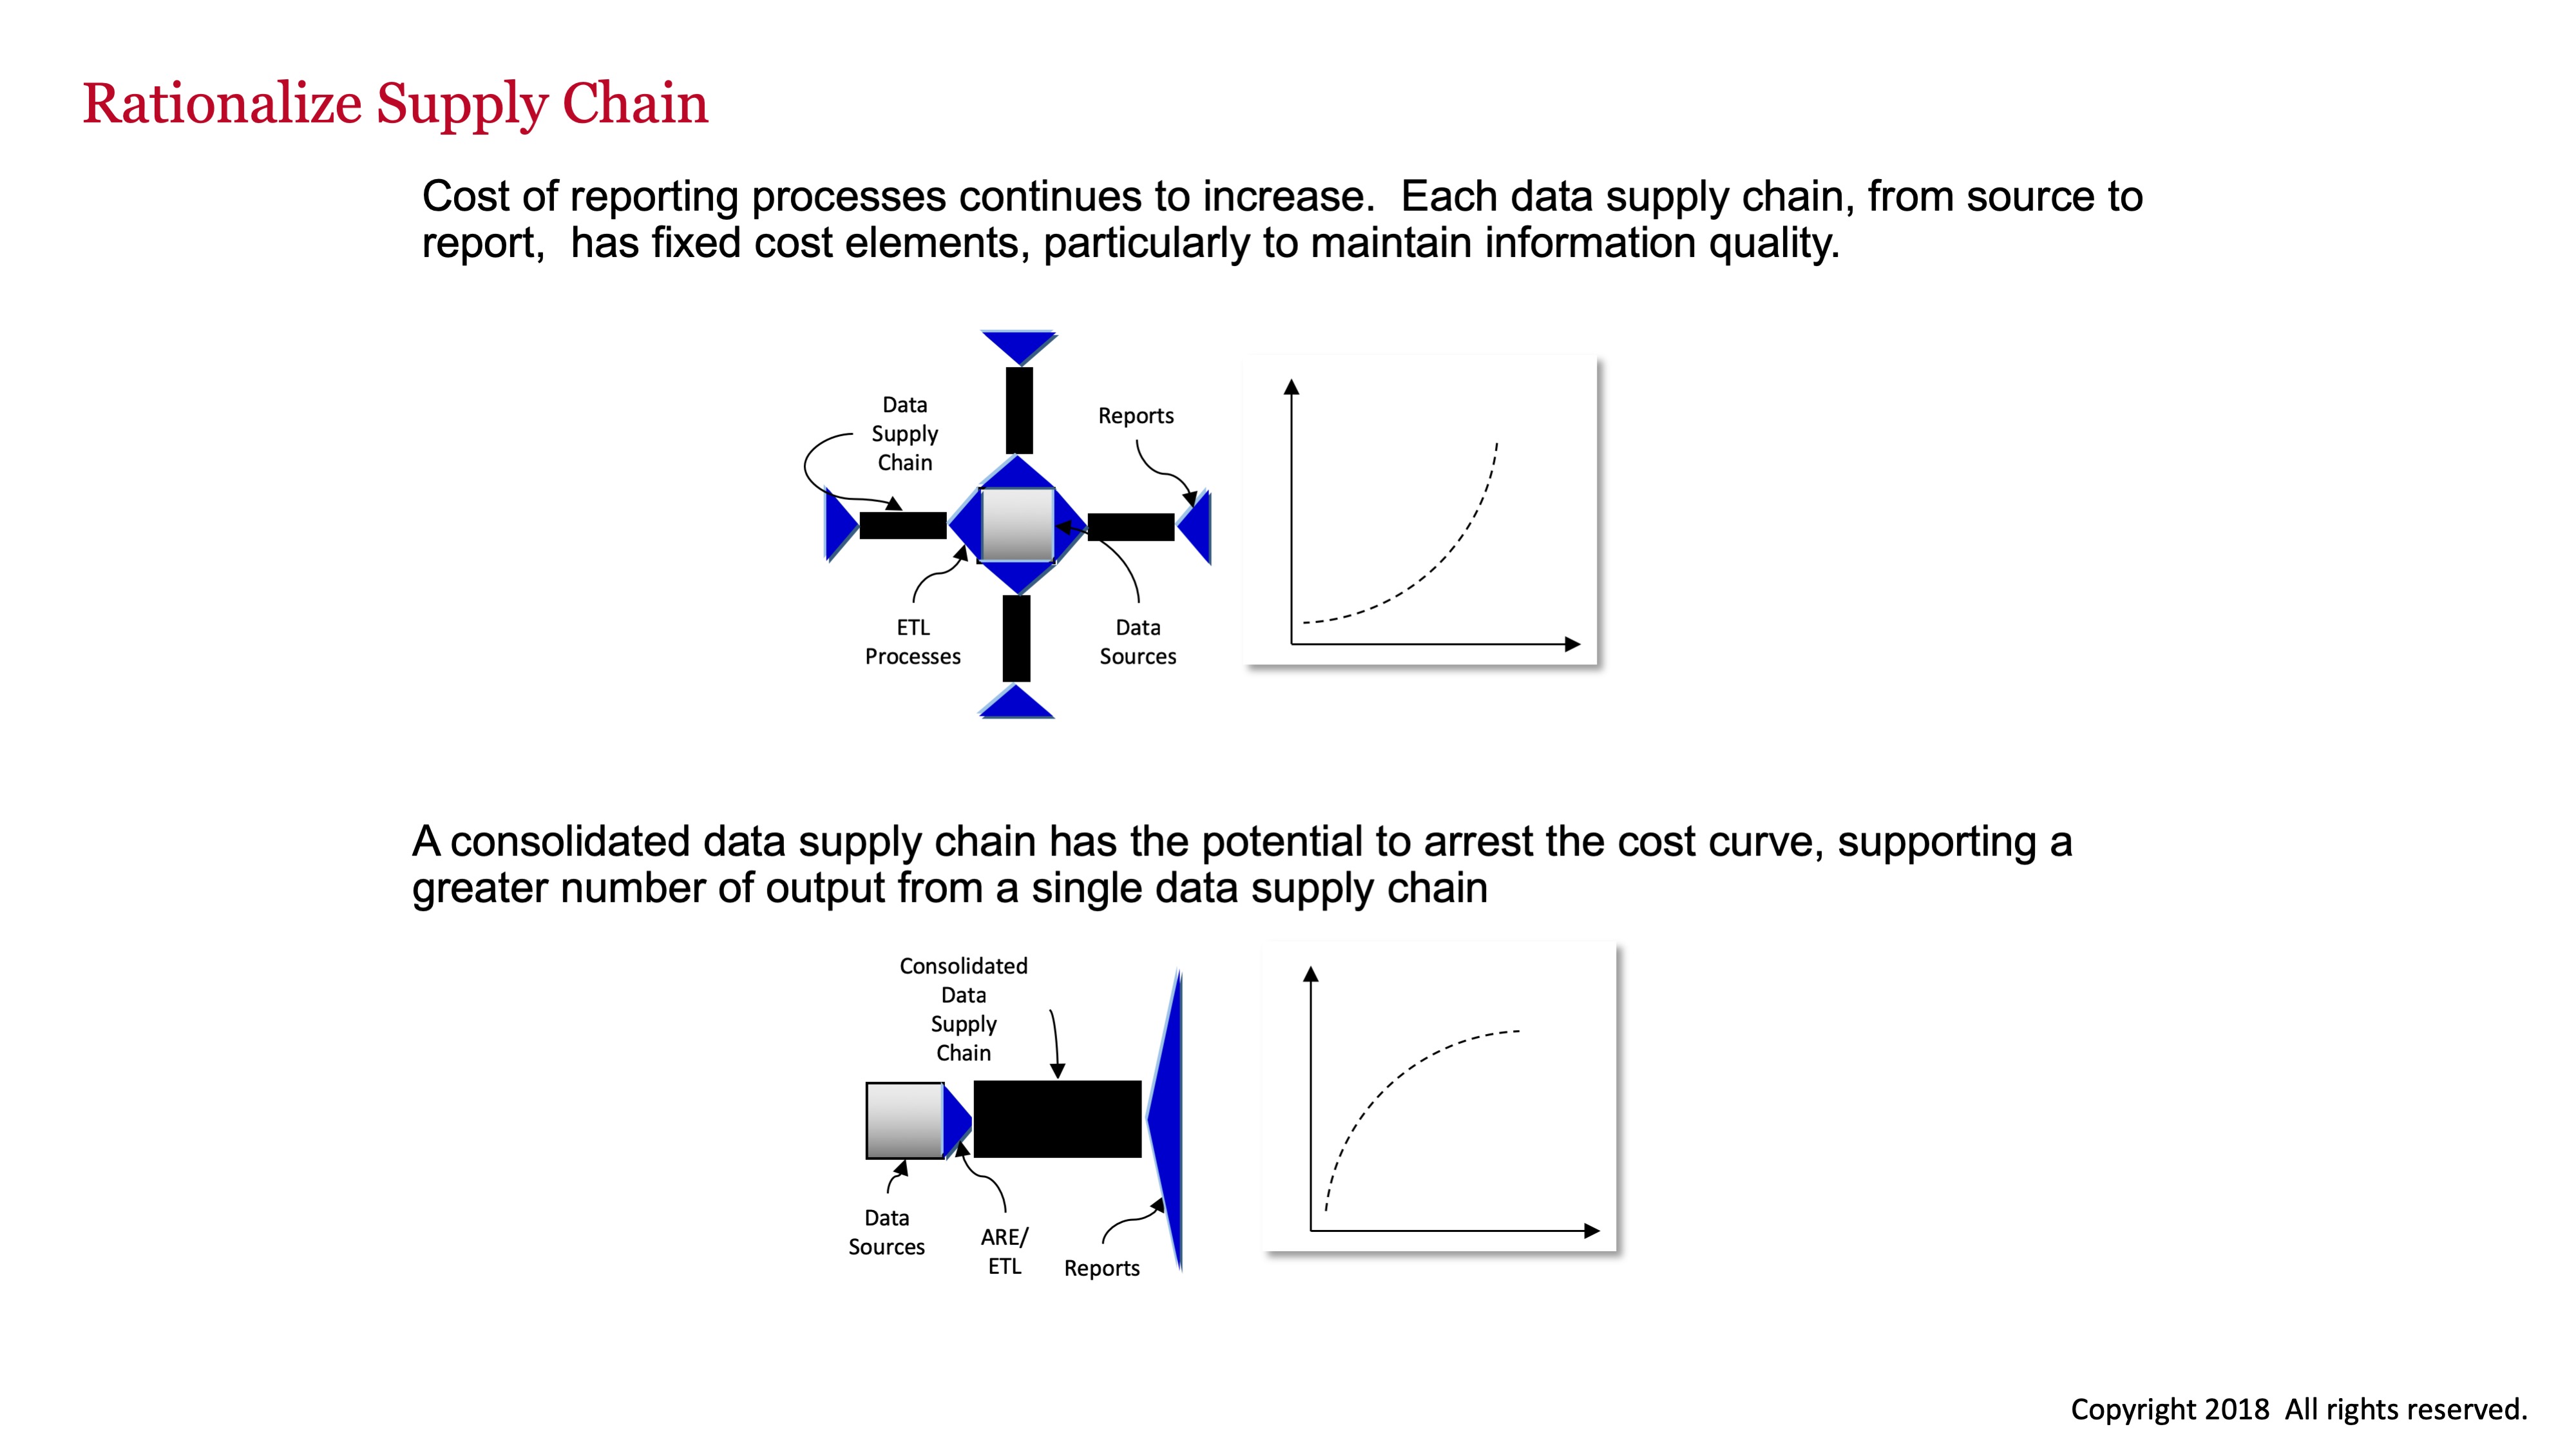
Data supply chains are like manufacturing supply chains; they take inputs and produce some output. There are numerous data supply chains in today’s organizations. Each is fixed in the types of outputs it can produce, which were decided when the system was initially defined.
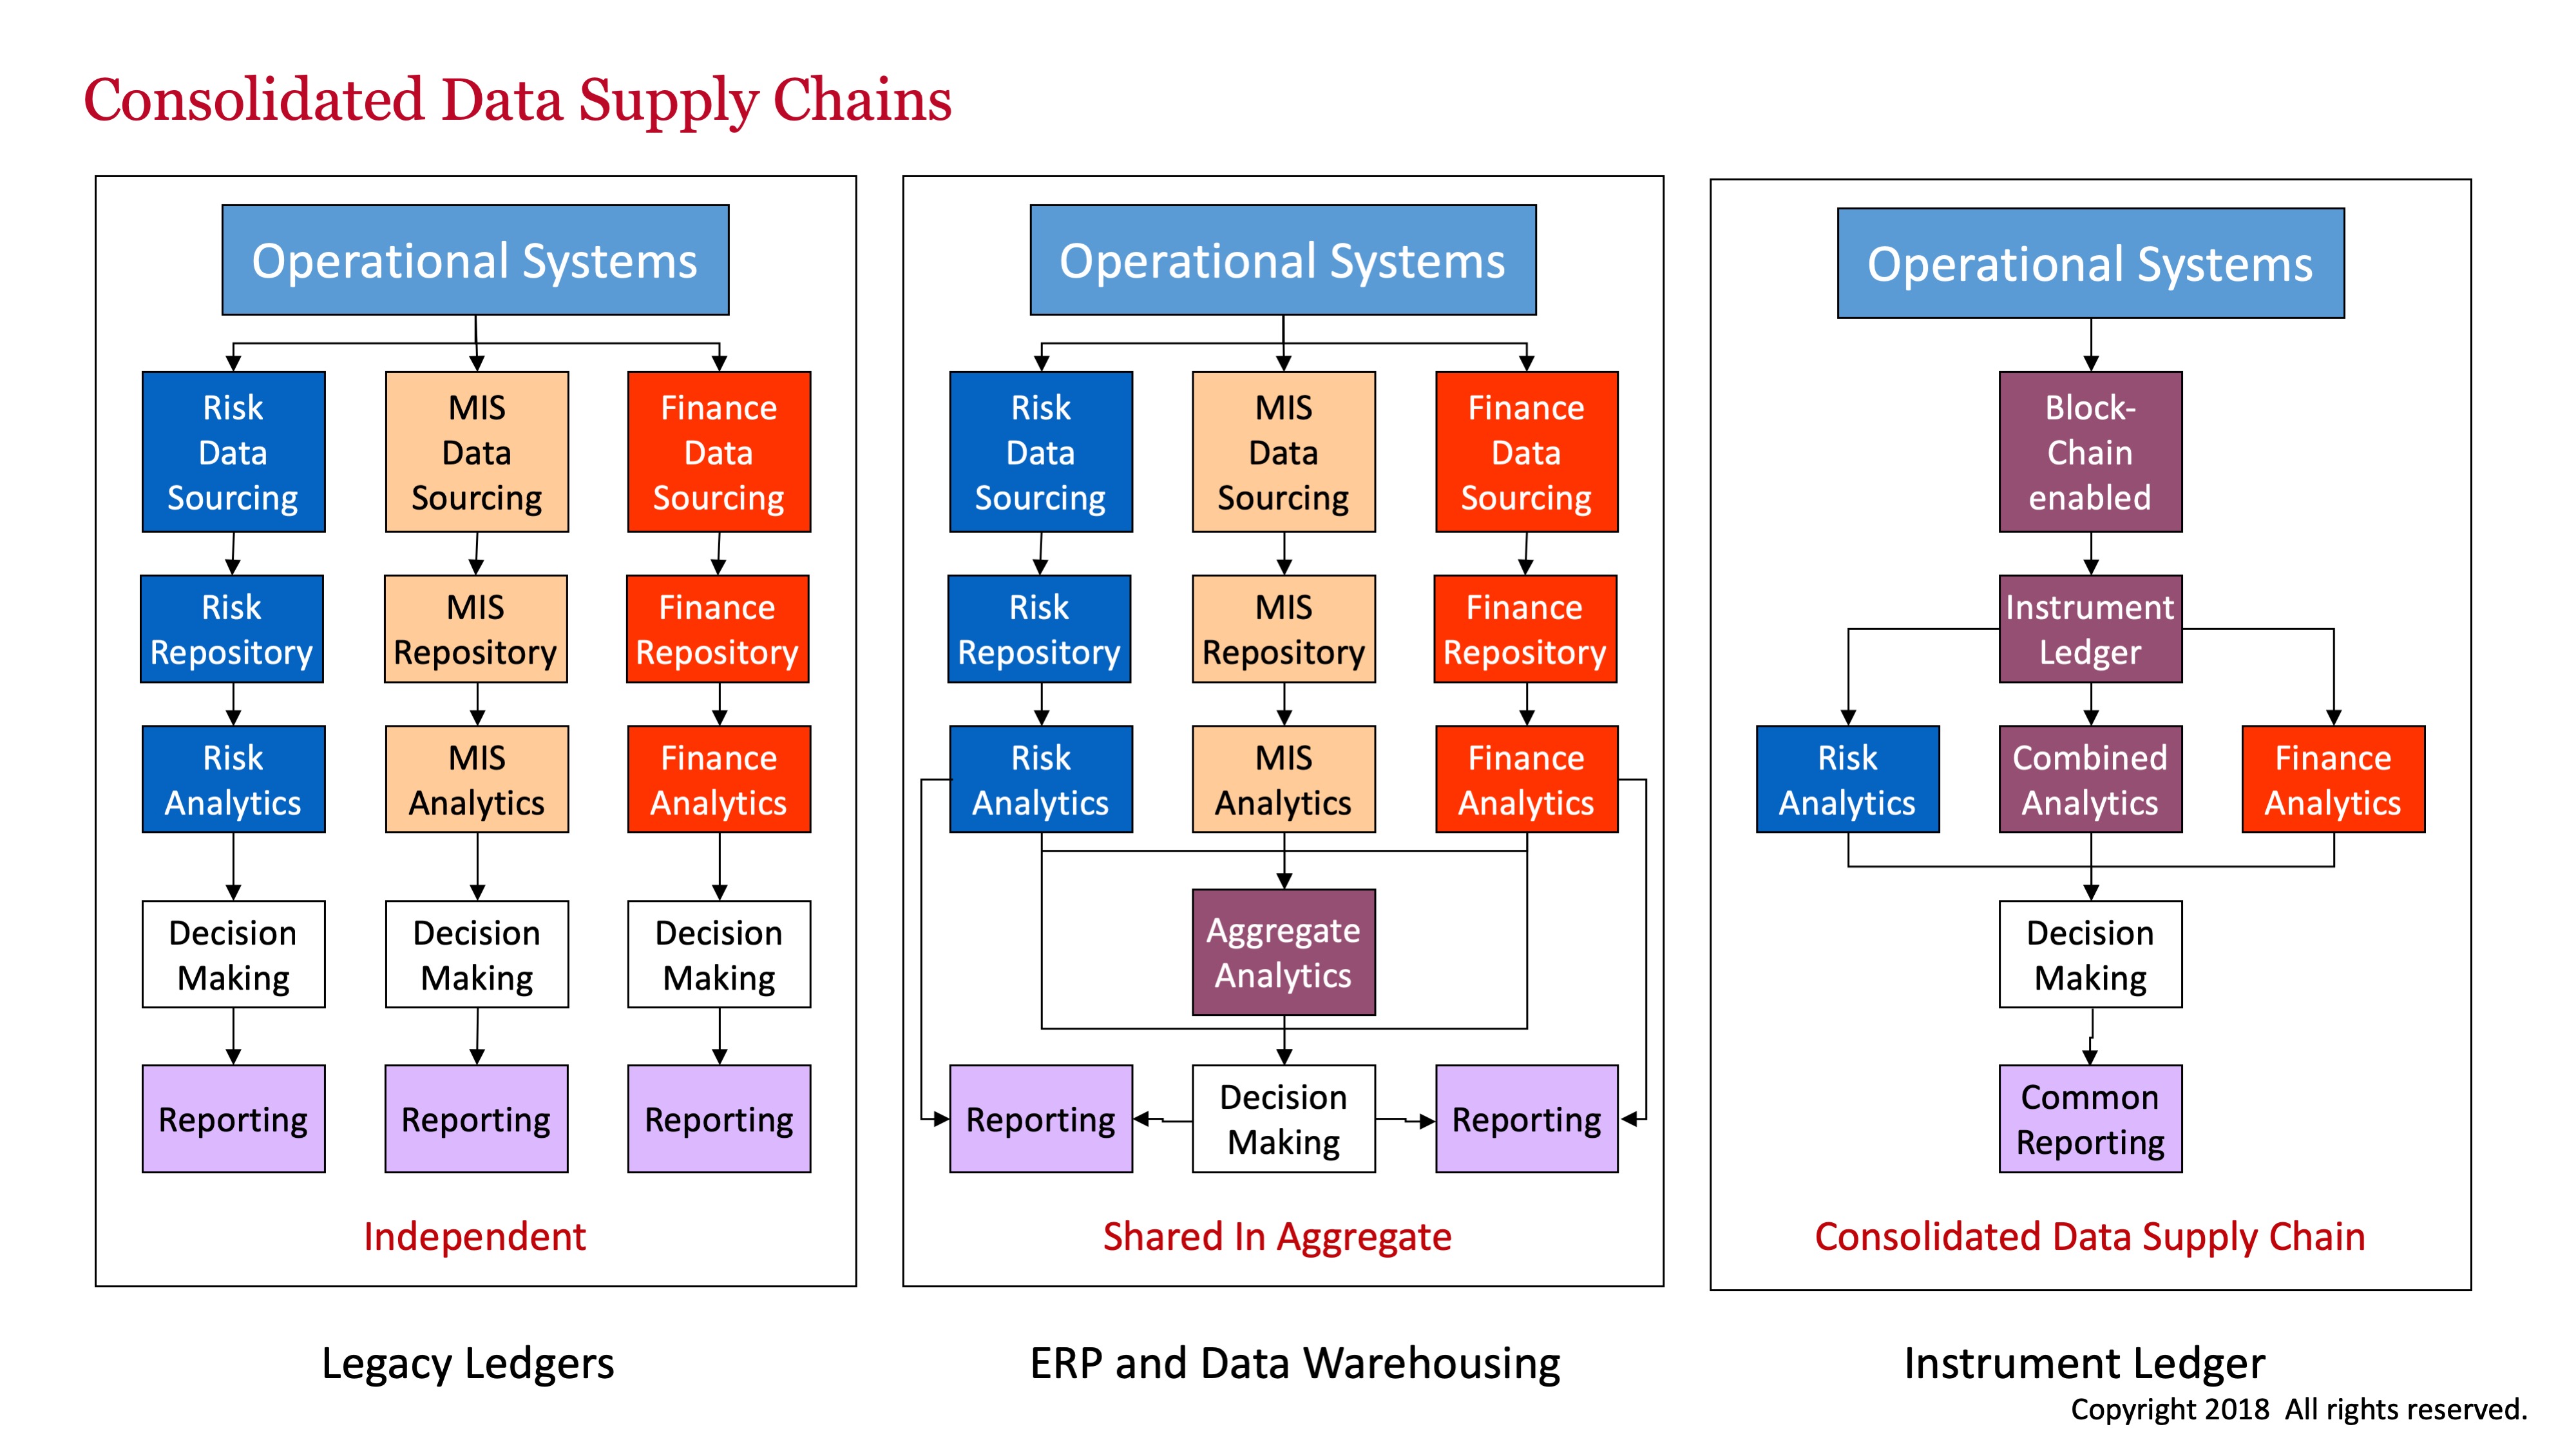
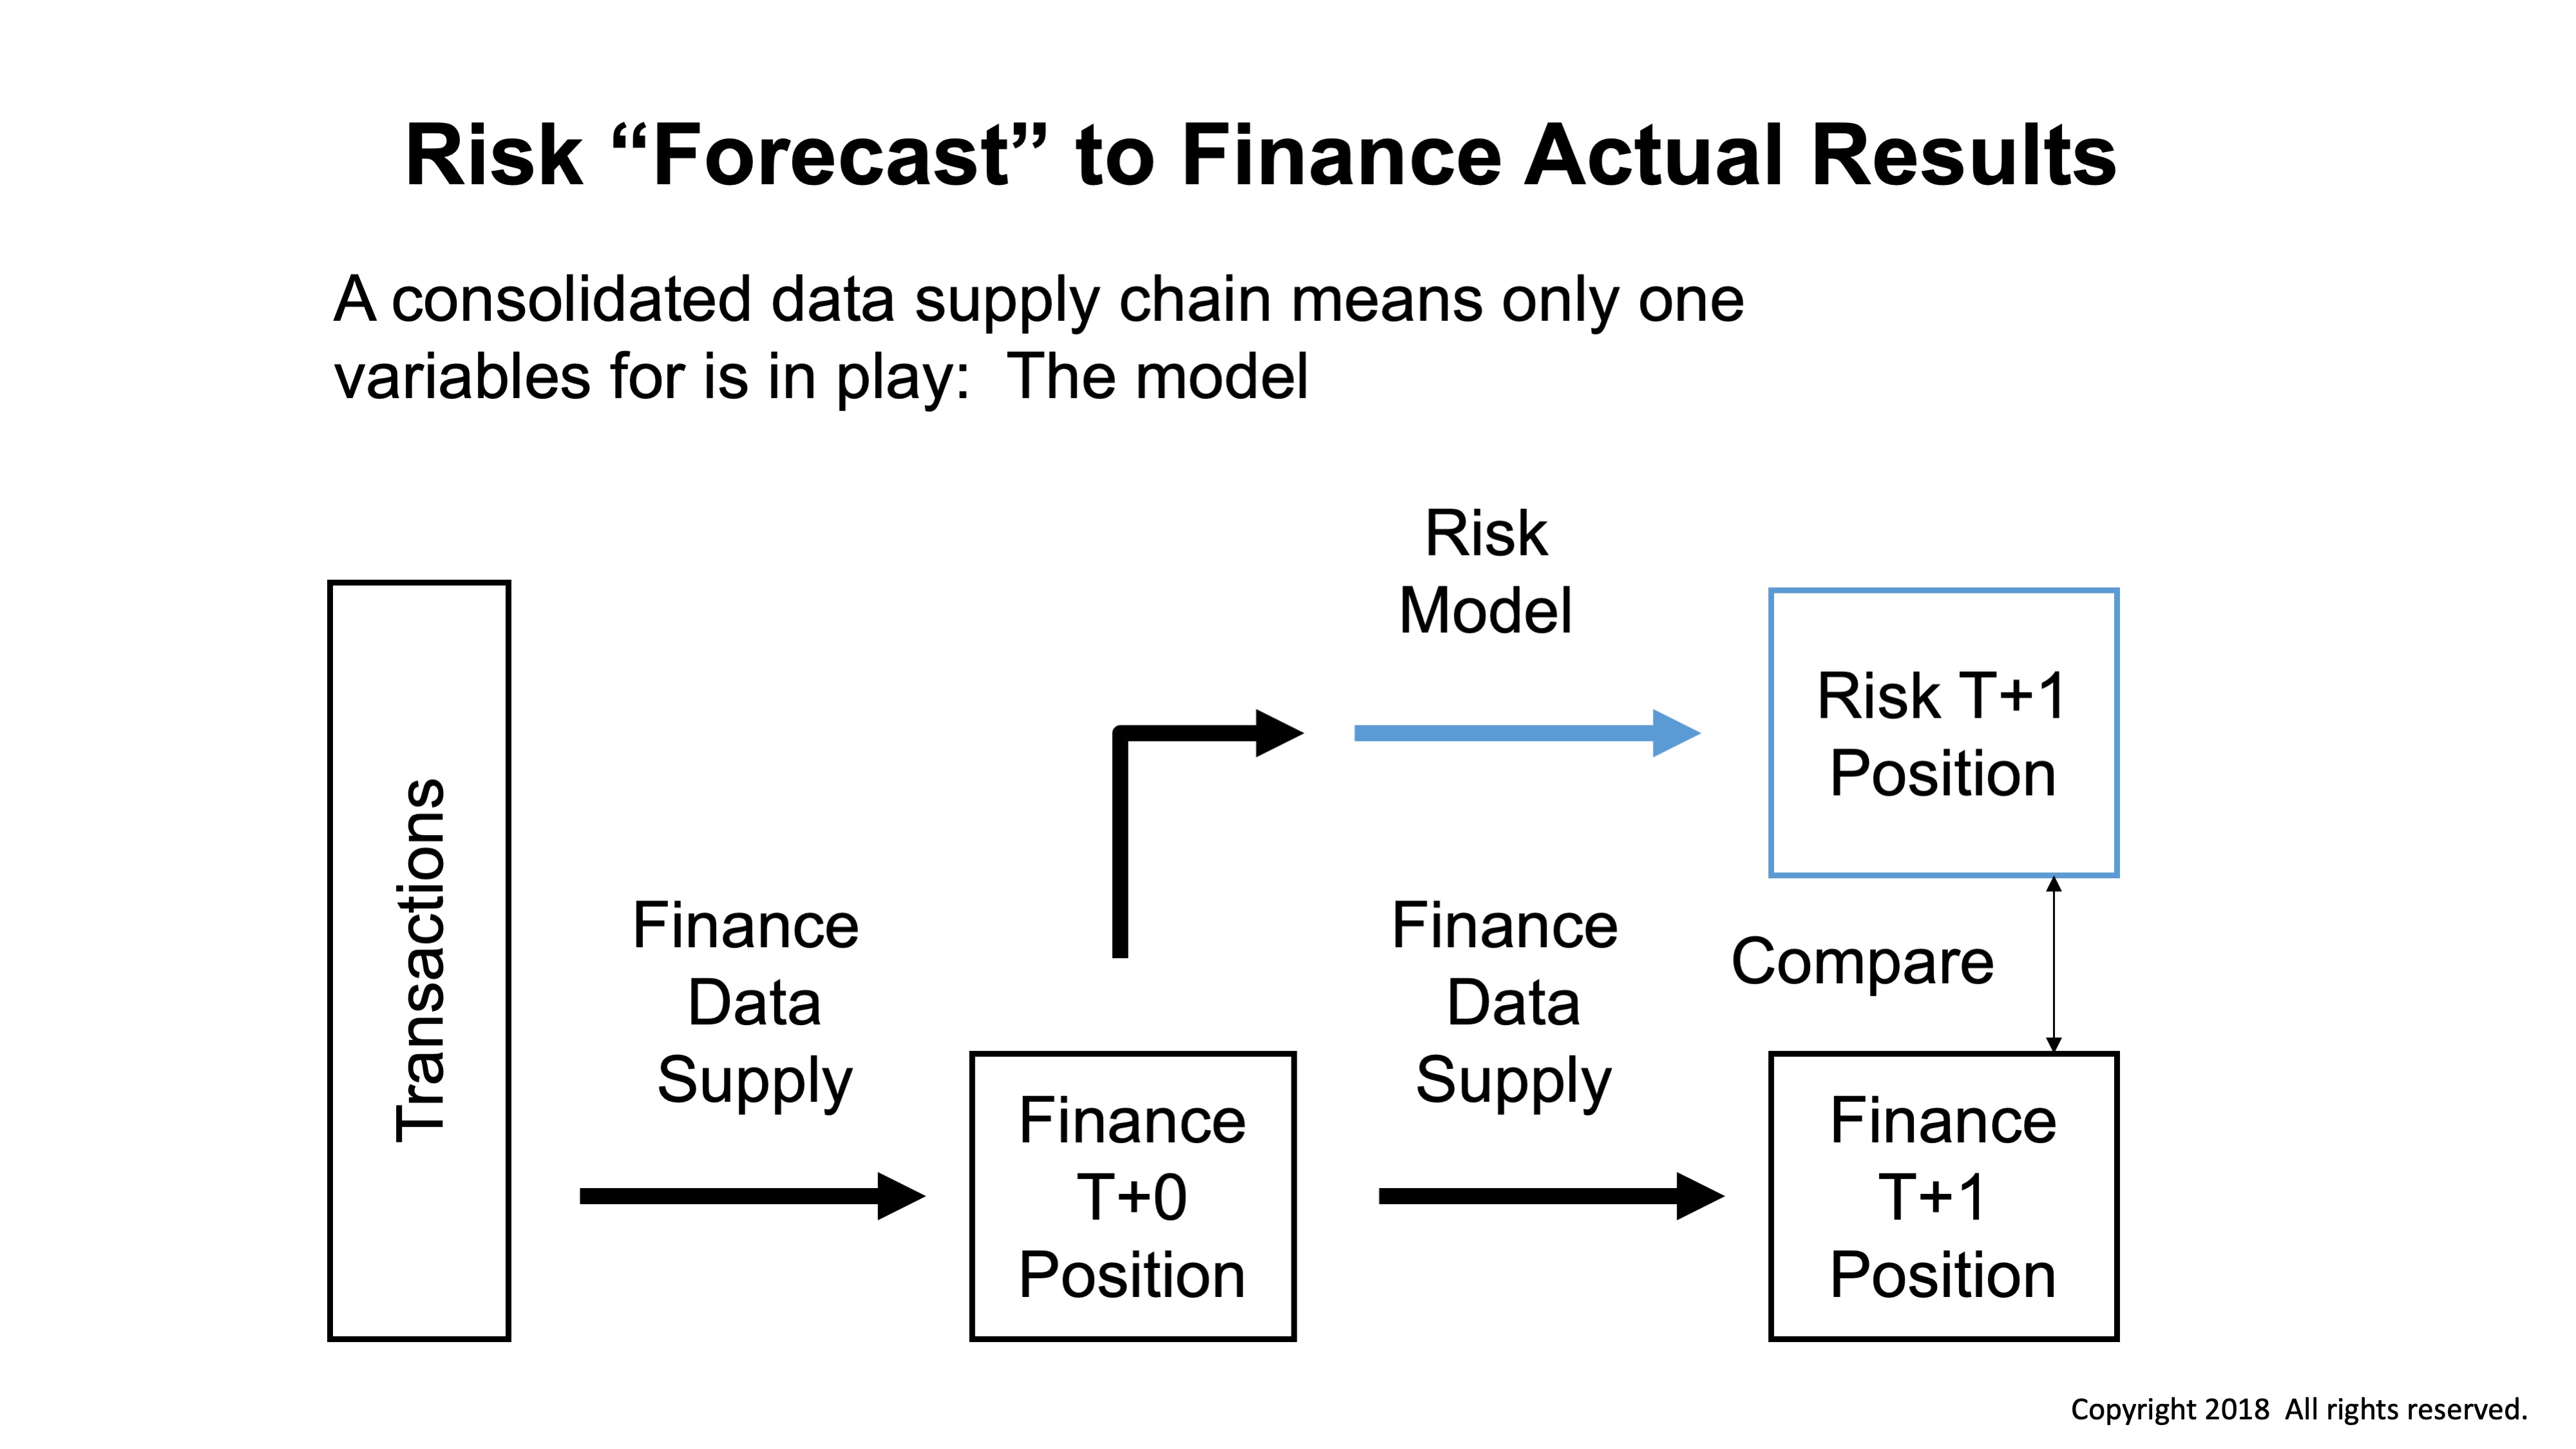
An alternative is to consolidate data supply chains, eliminating the fixed overhead for each, and increasing the quality of information available.
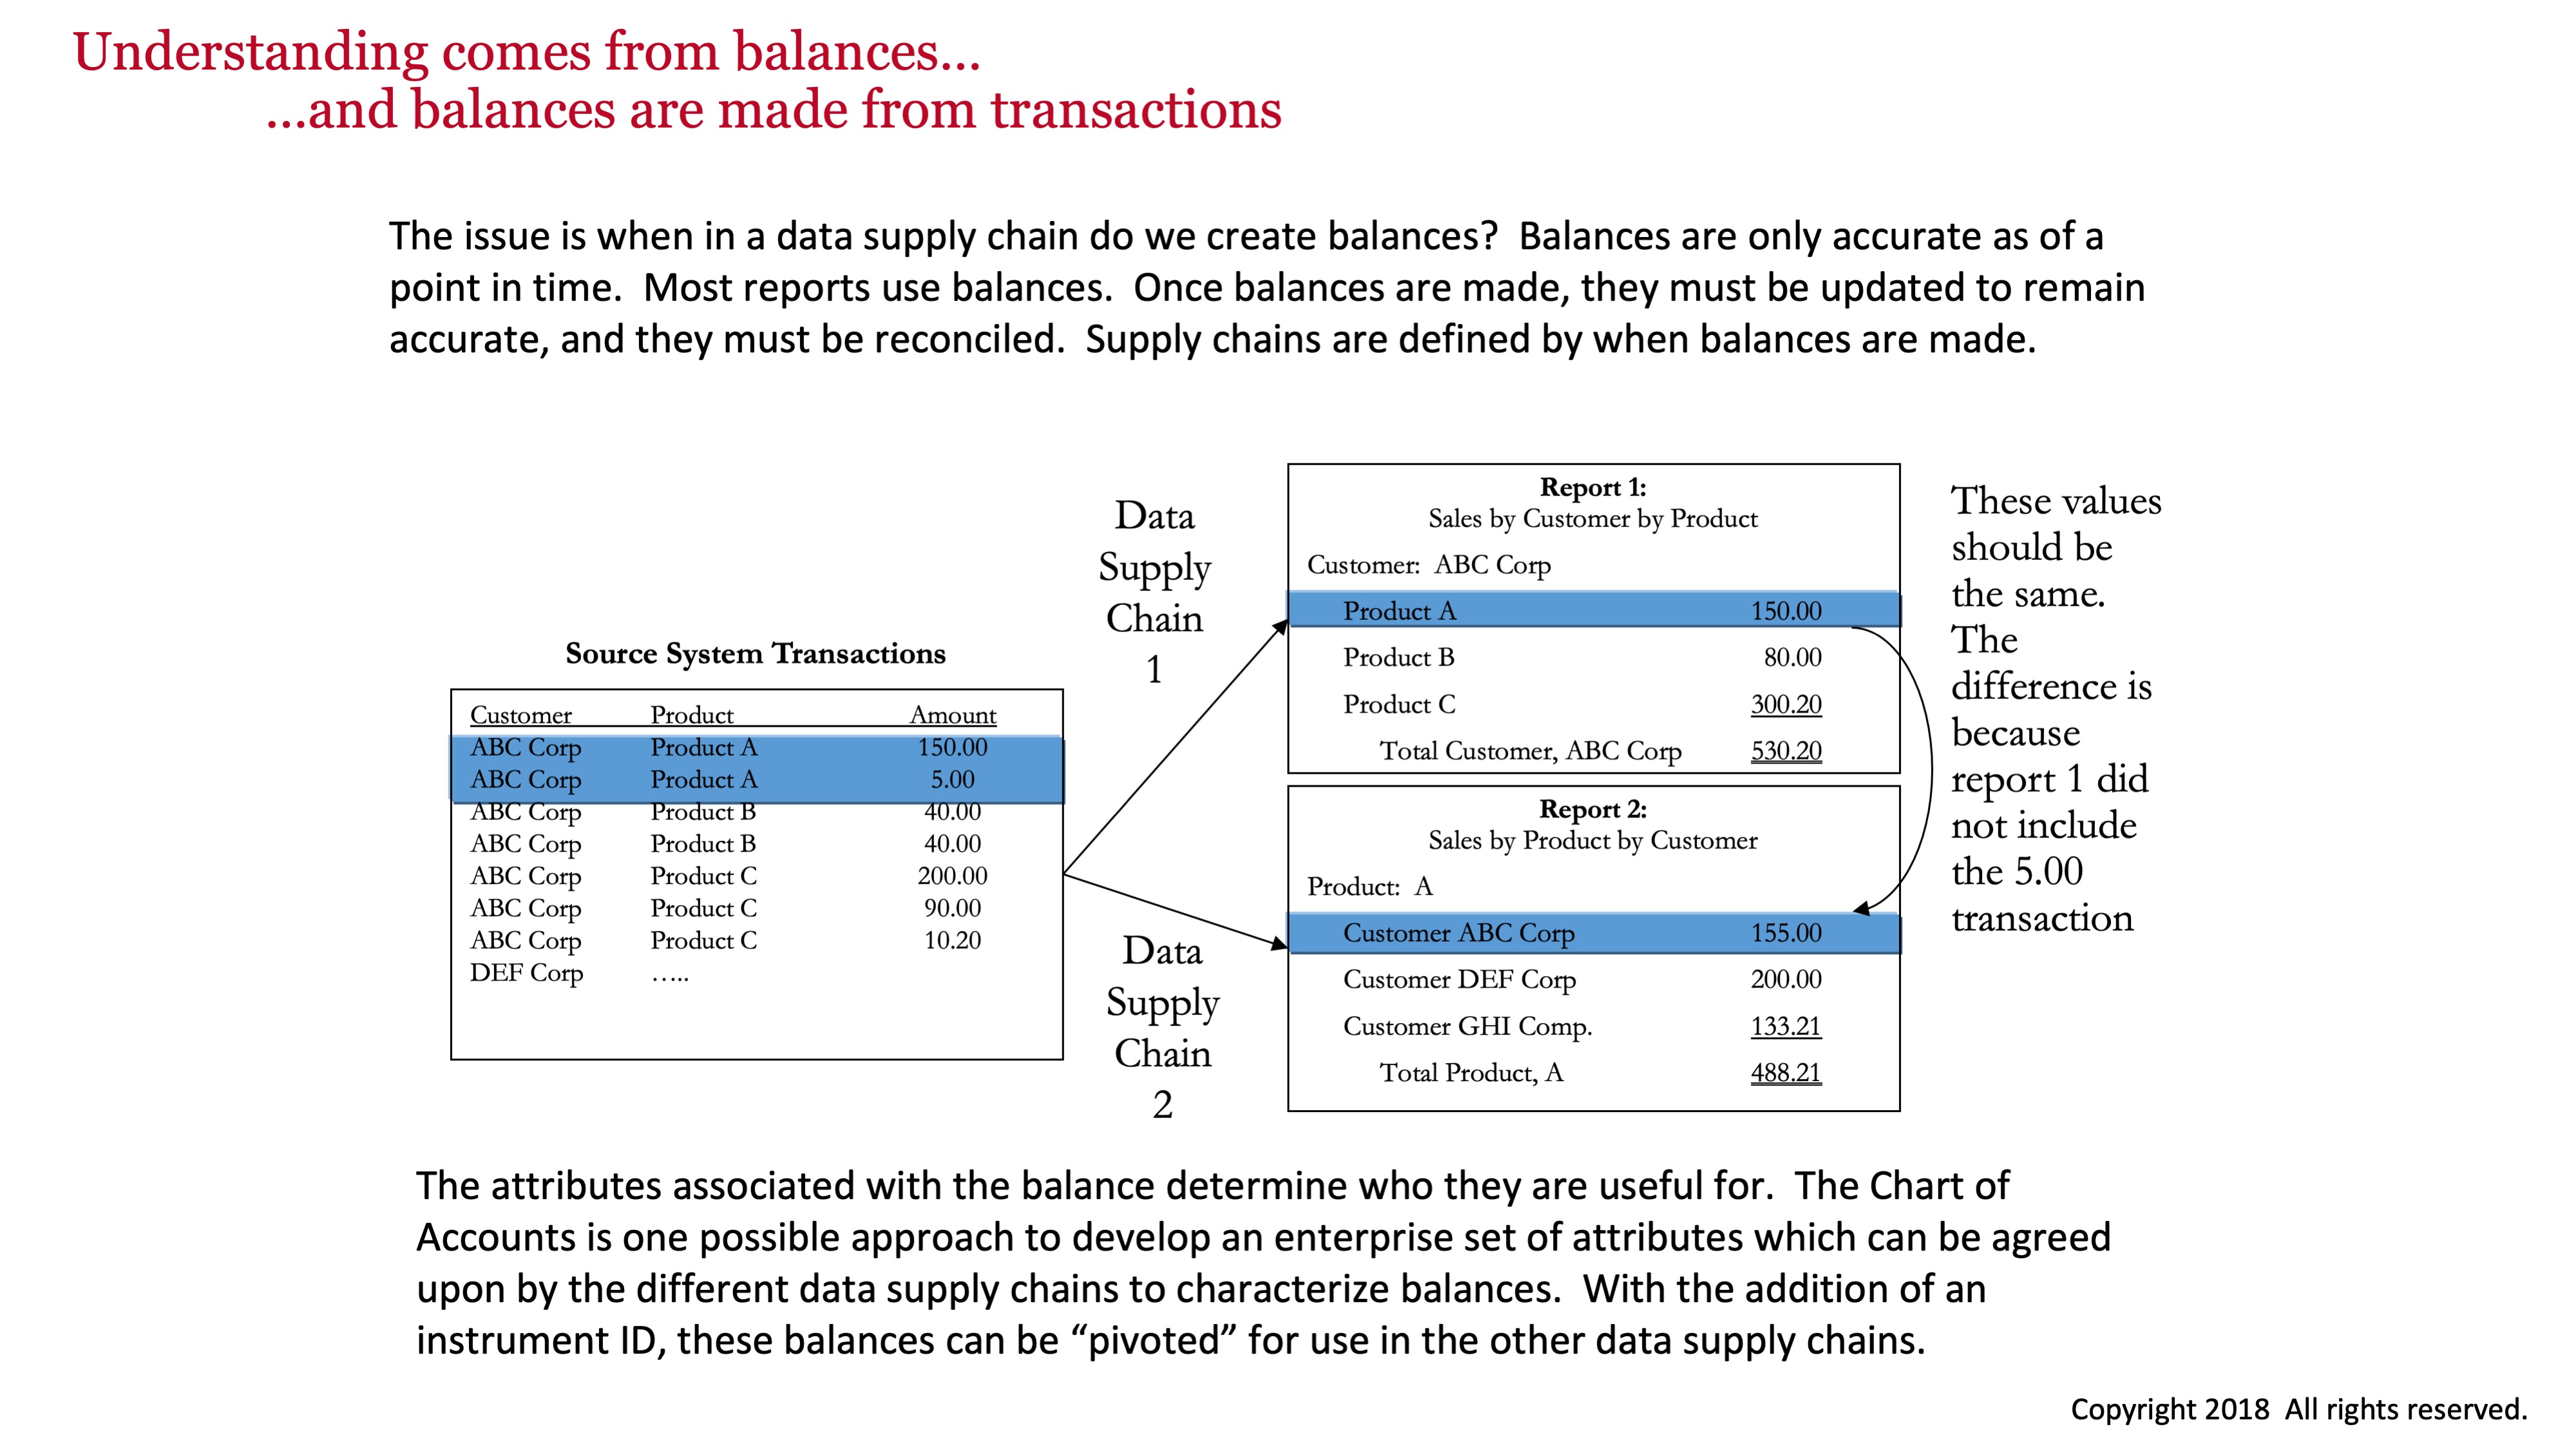
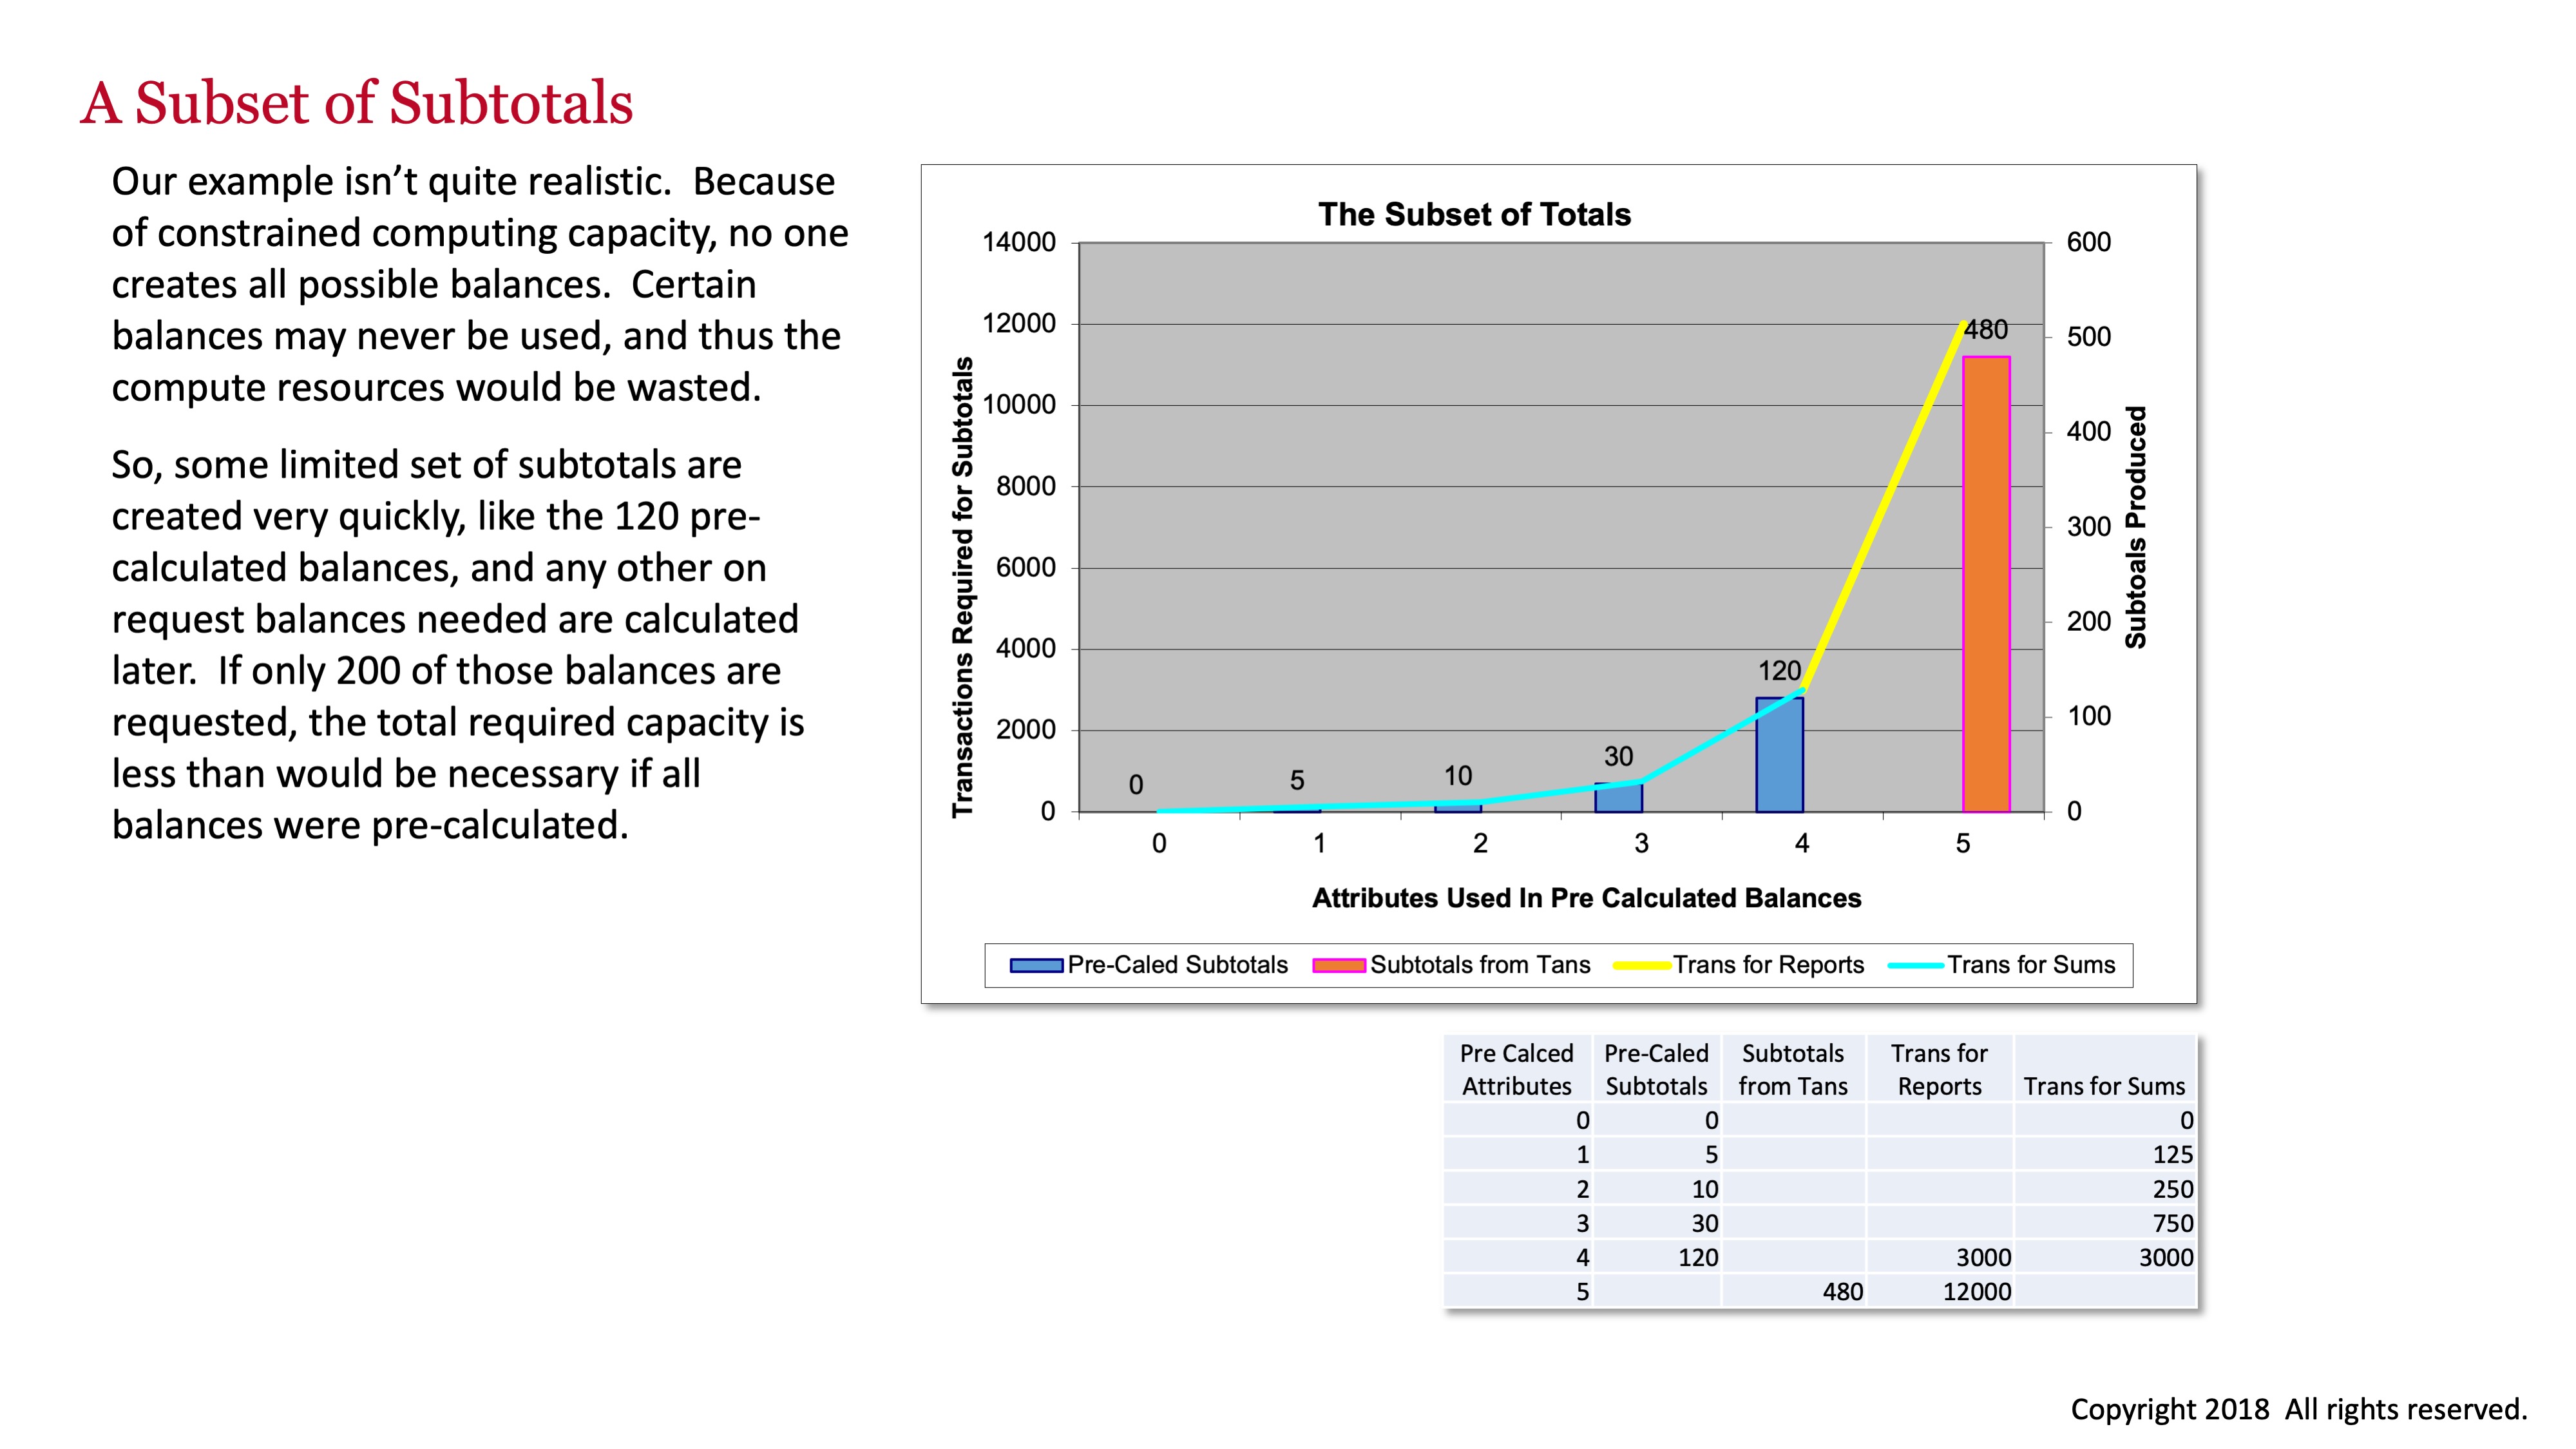
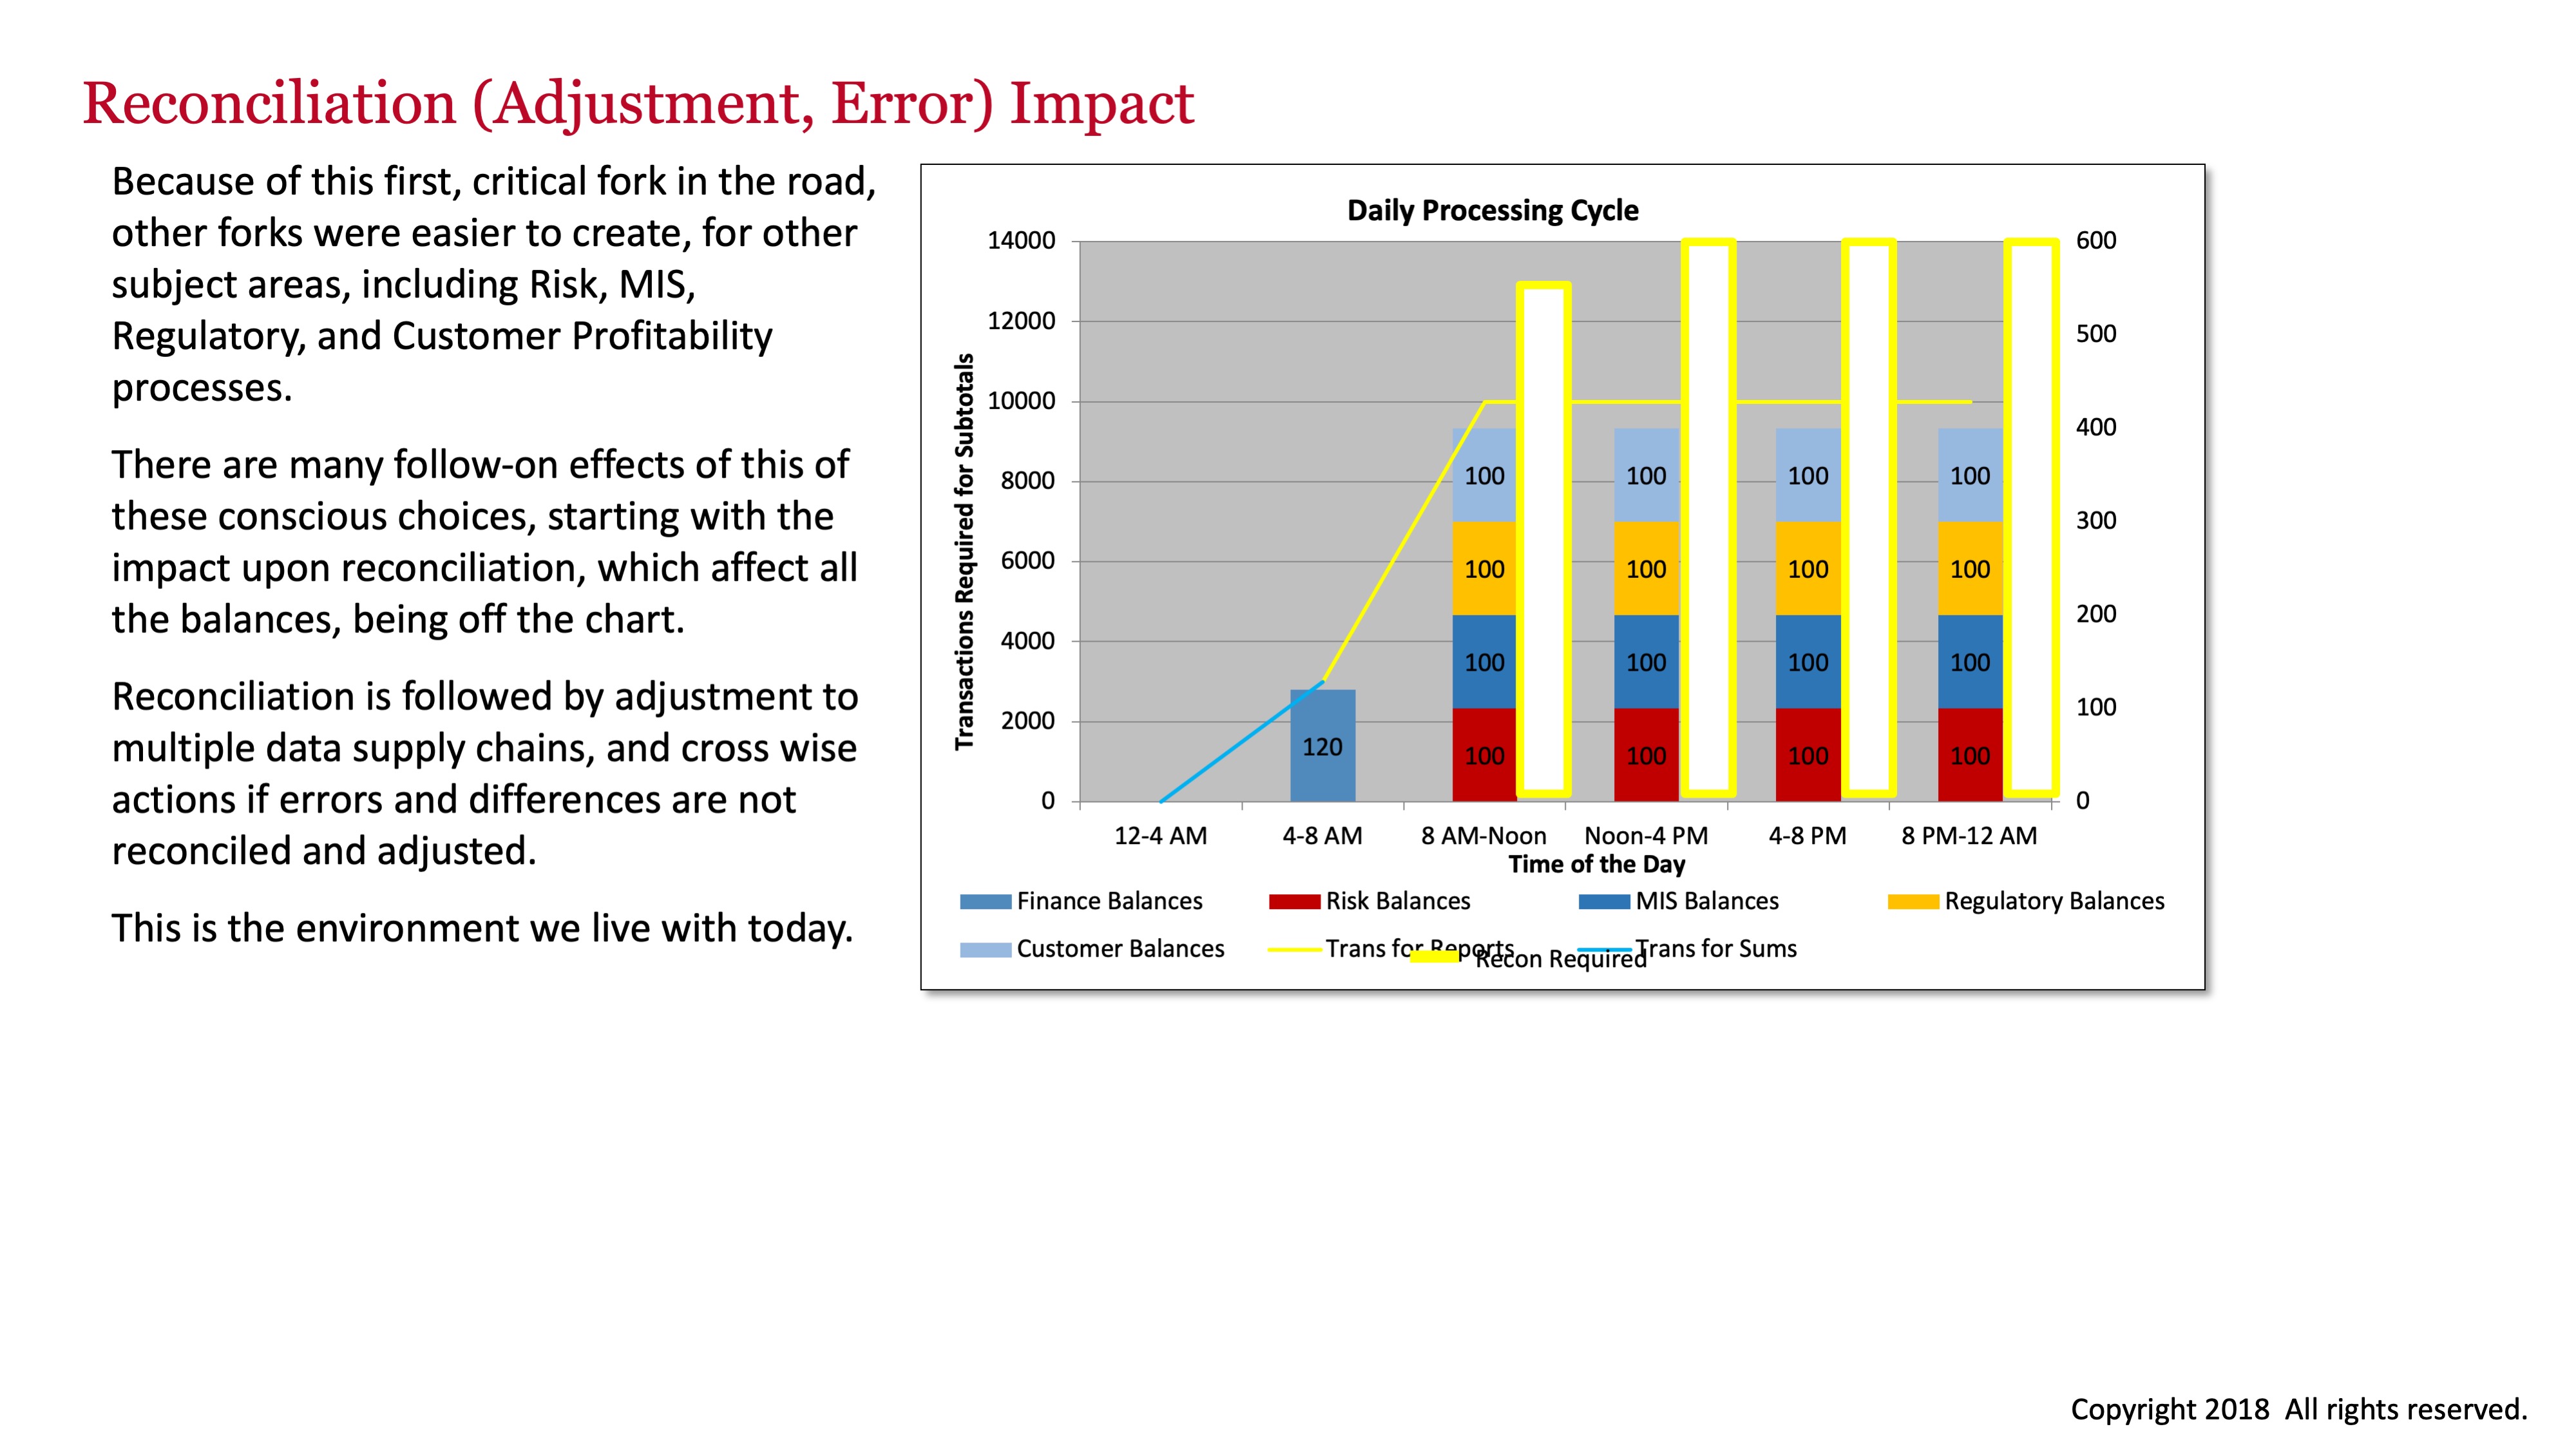
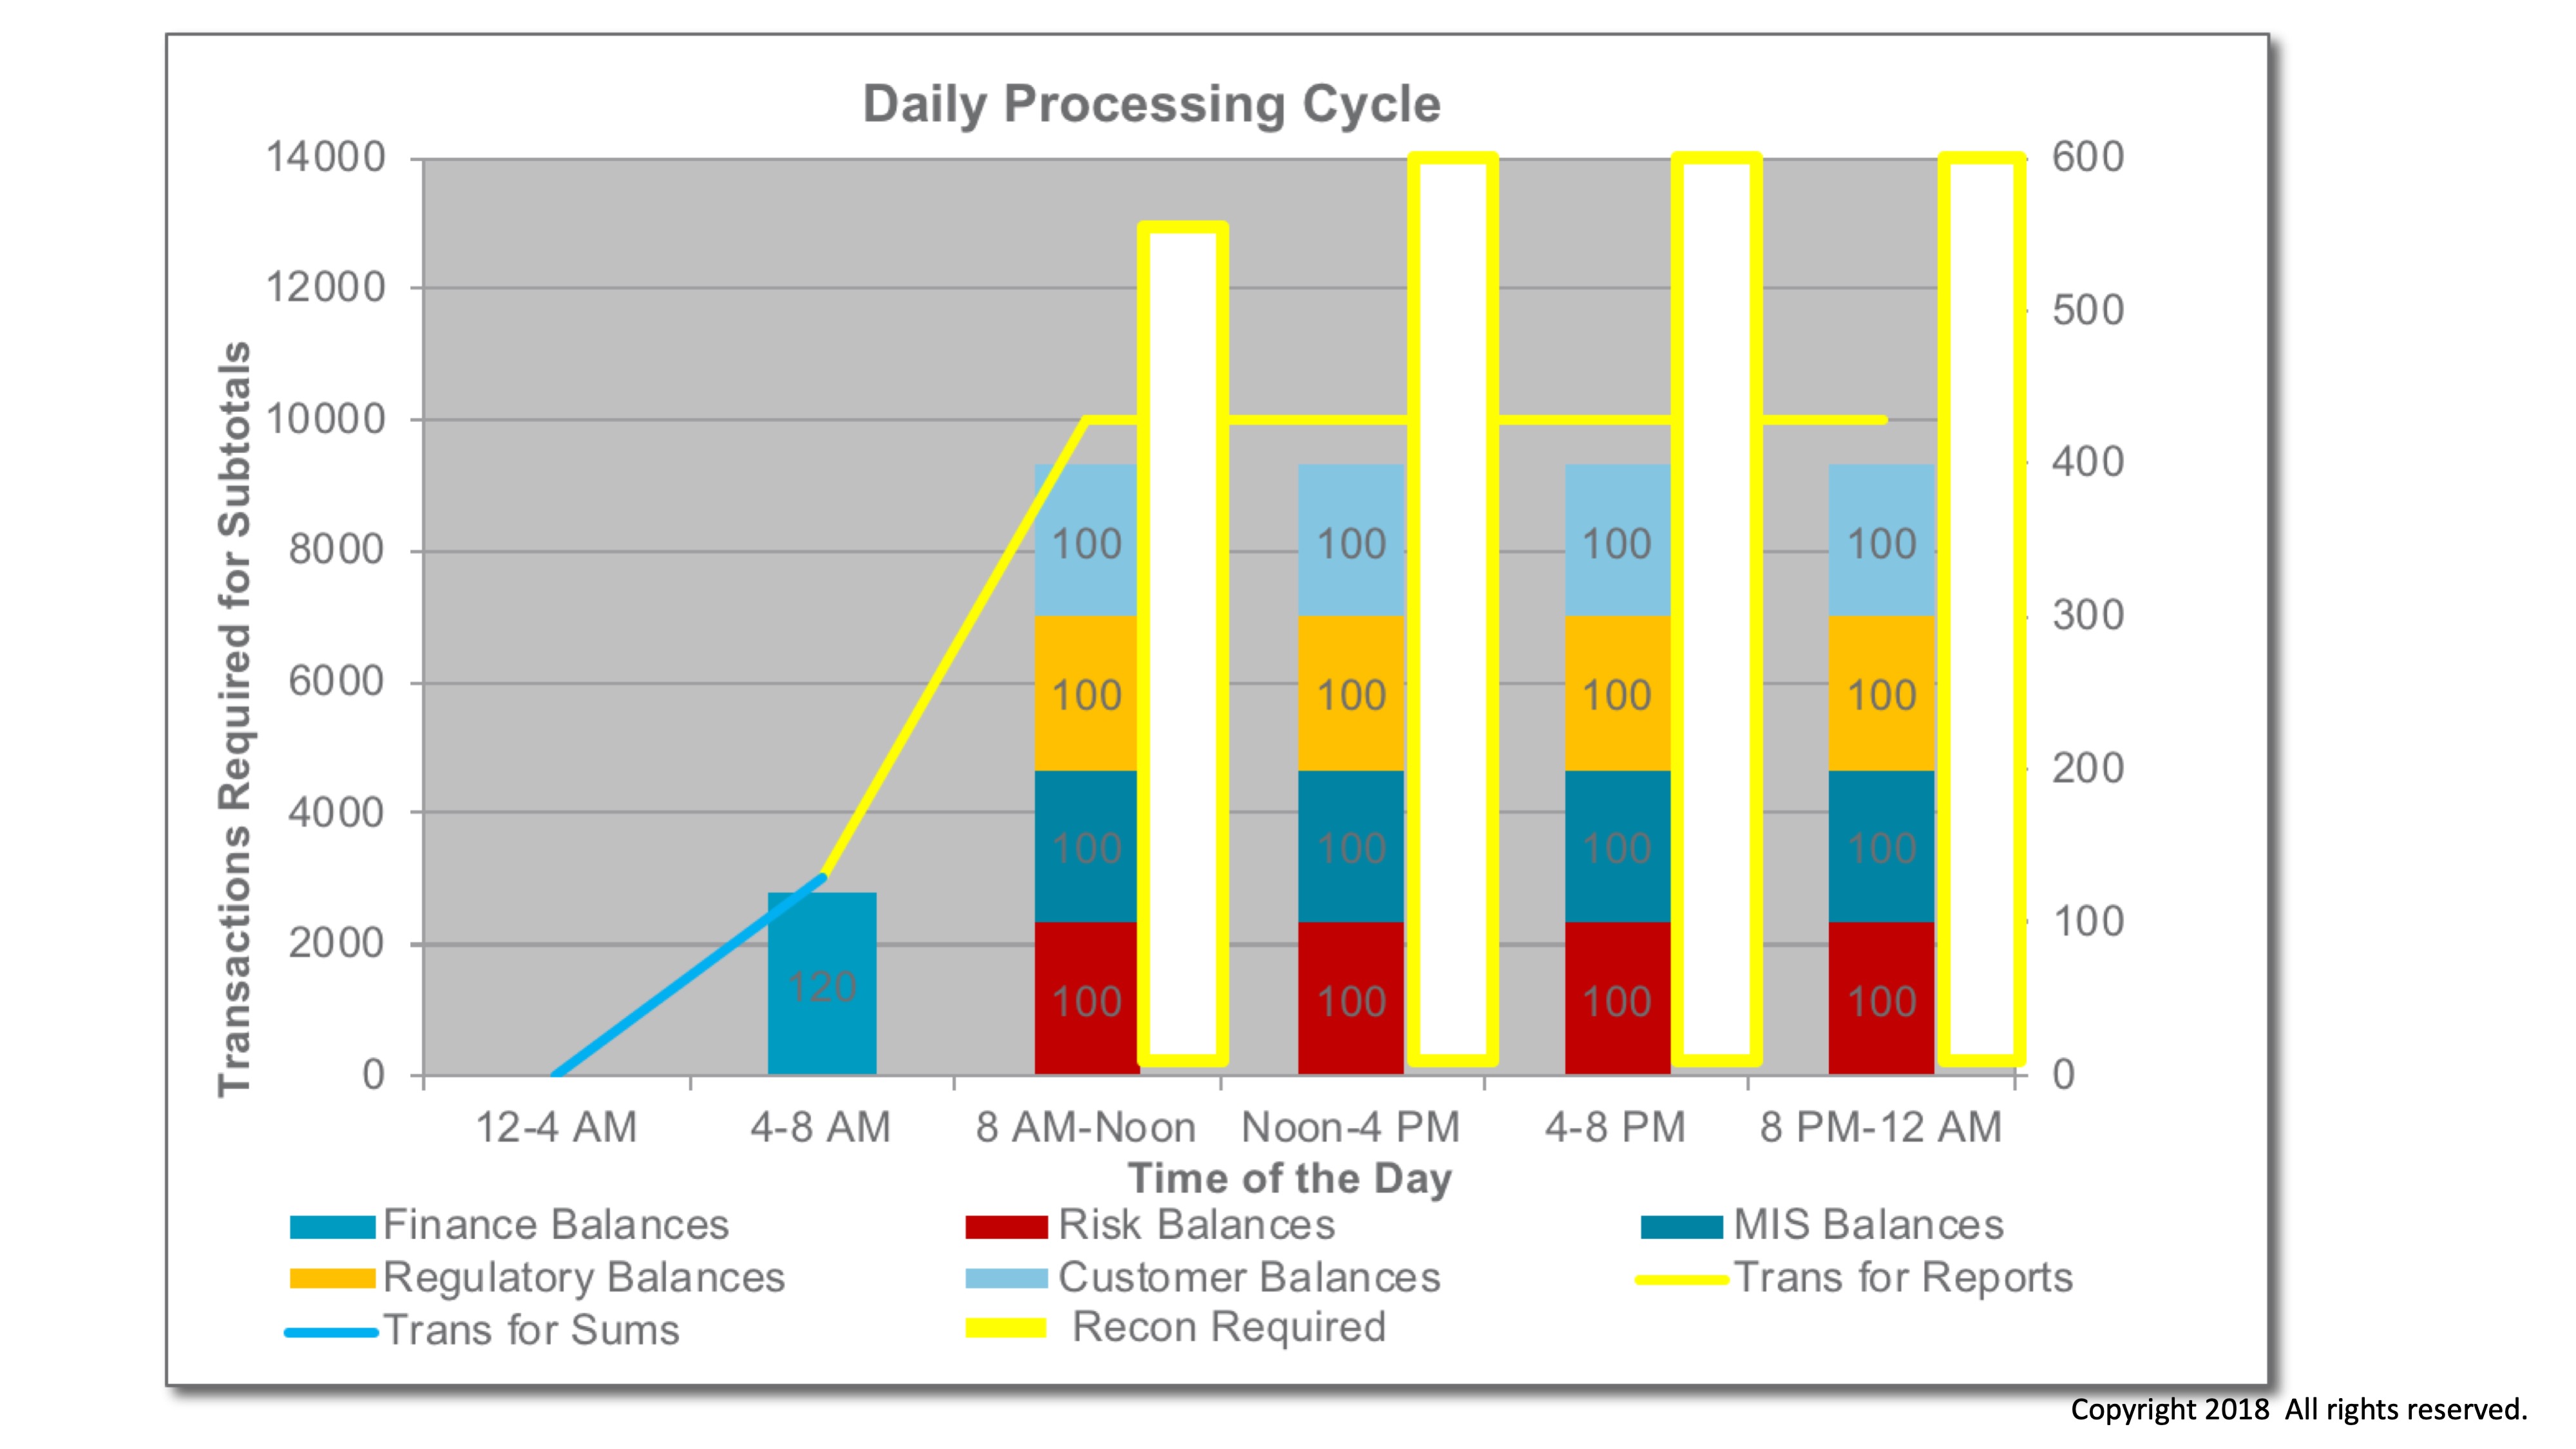
Daily Financial Cycle Graphs
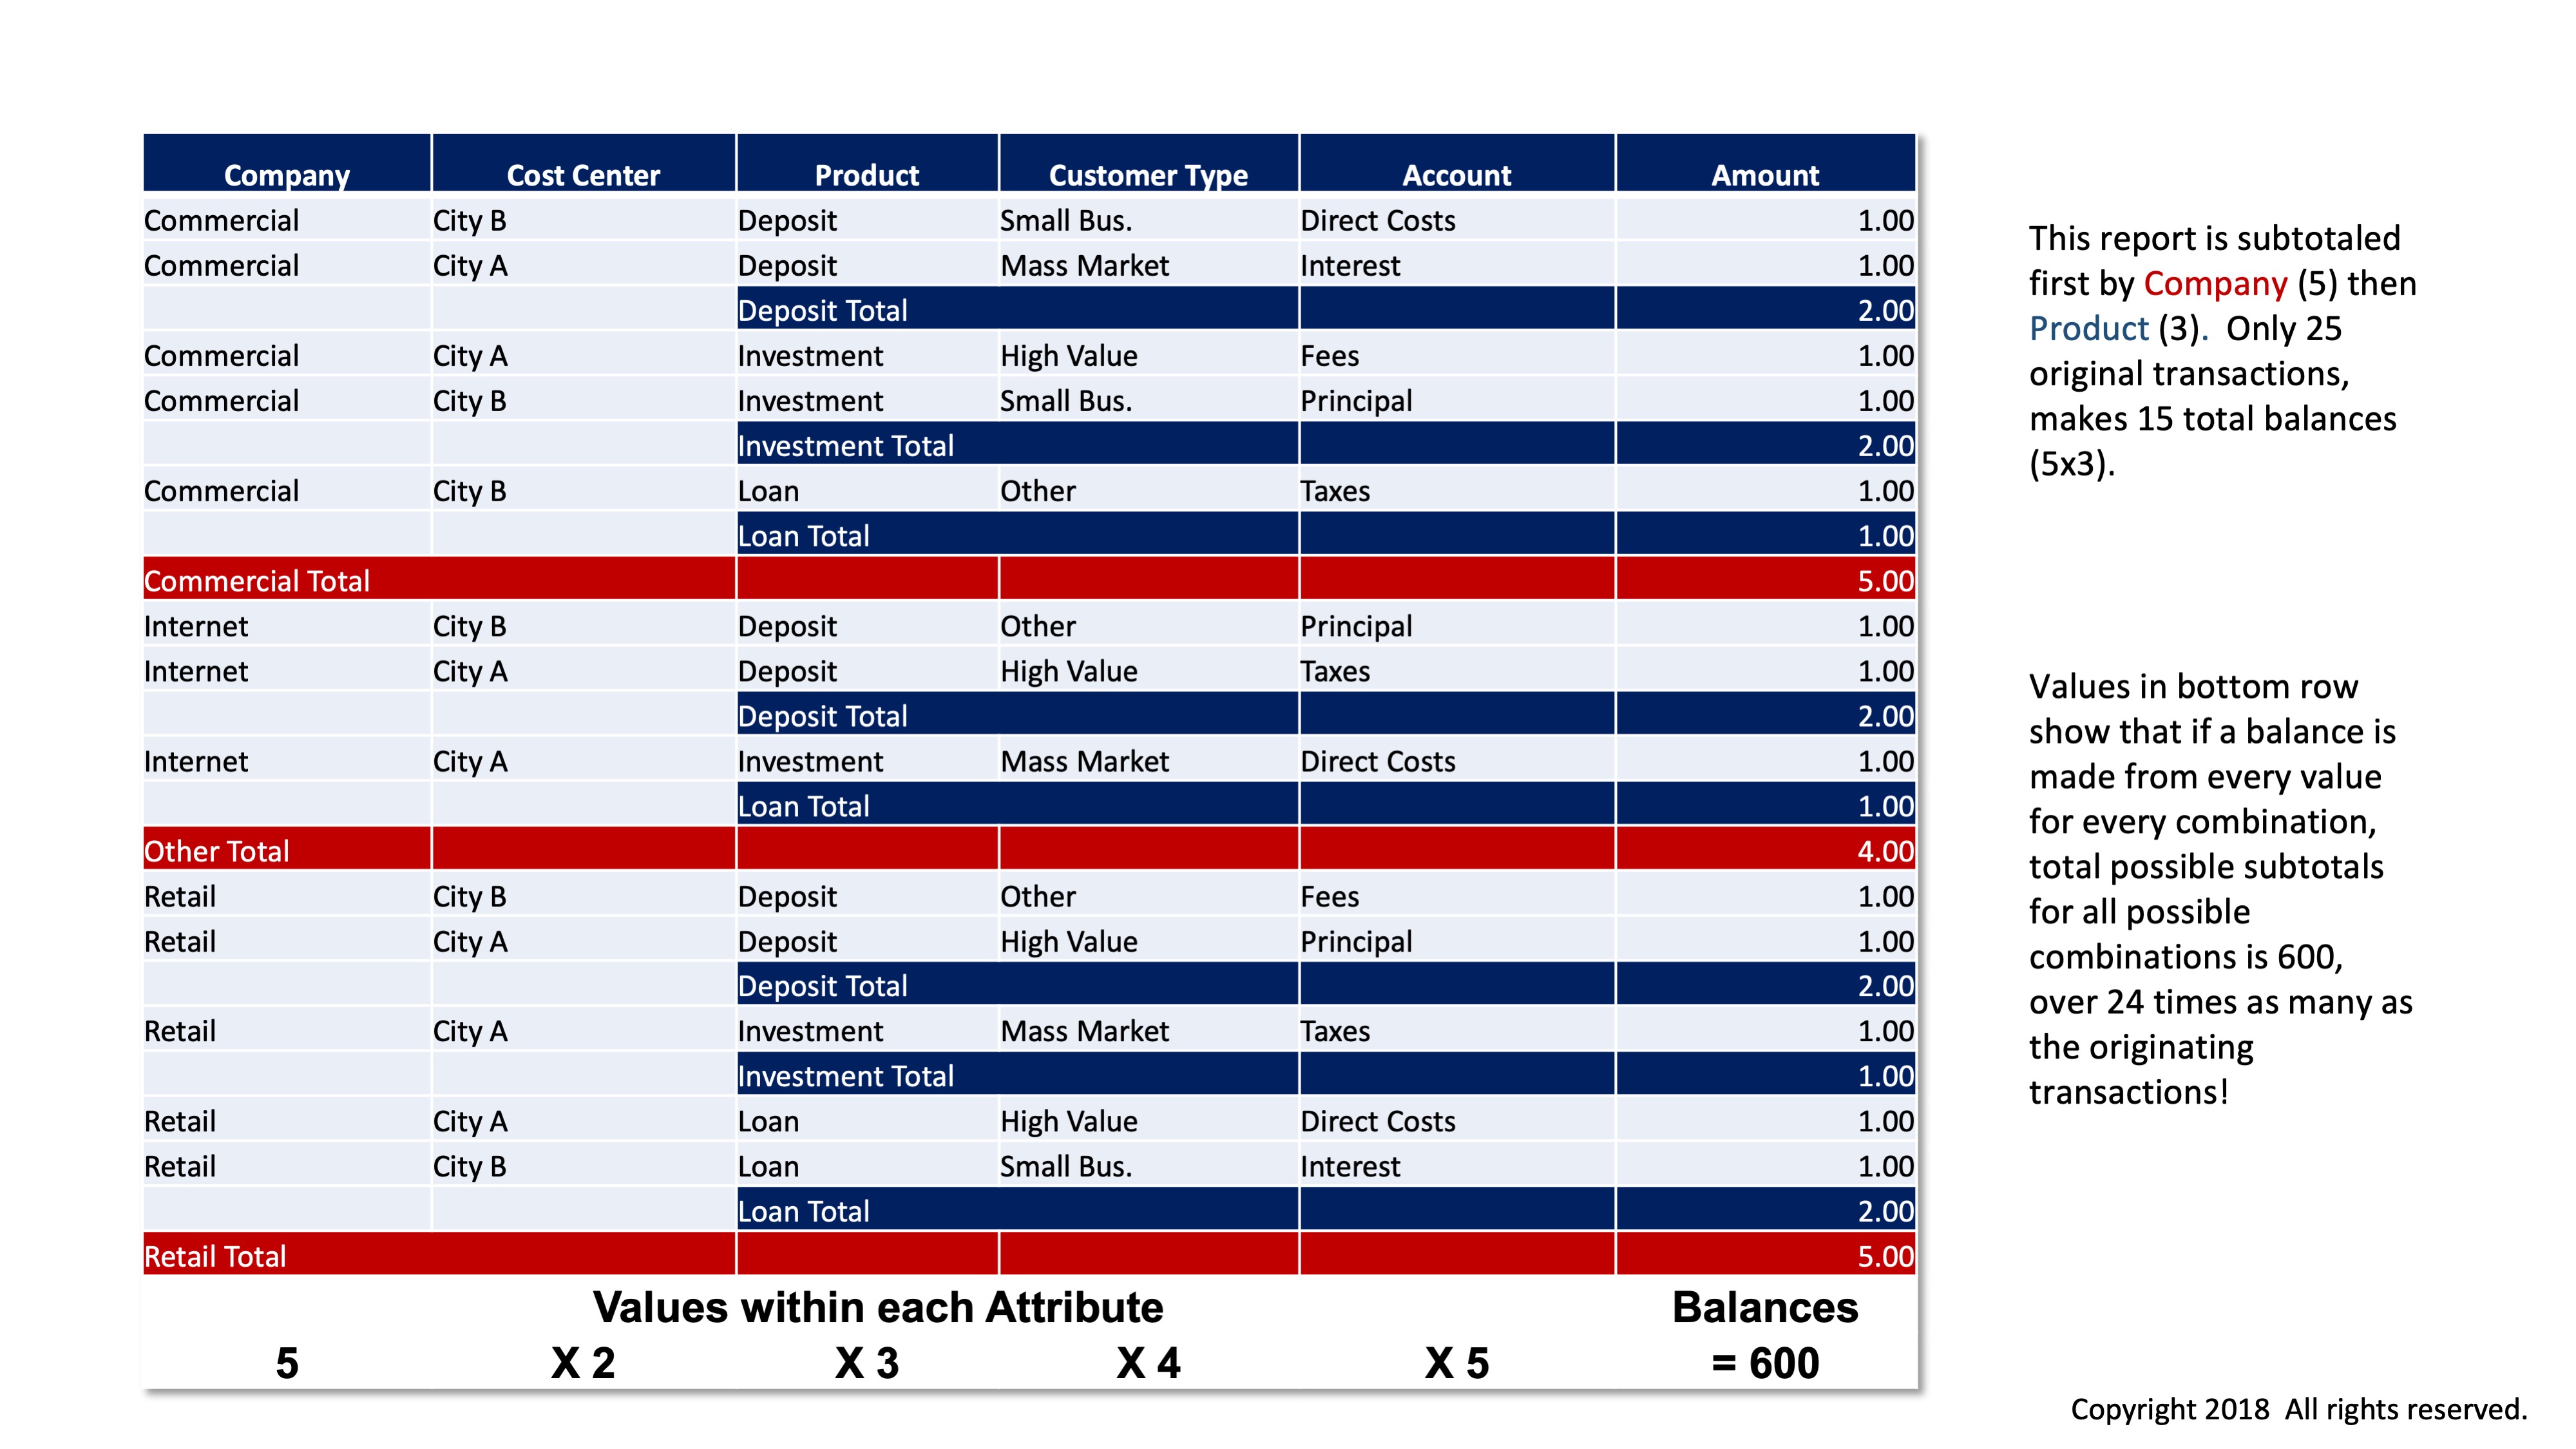
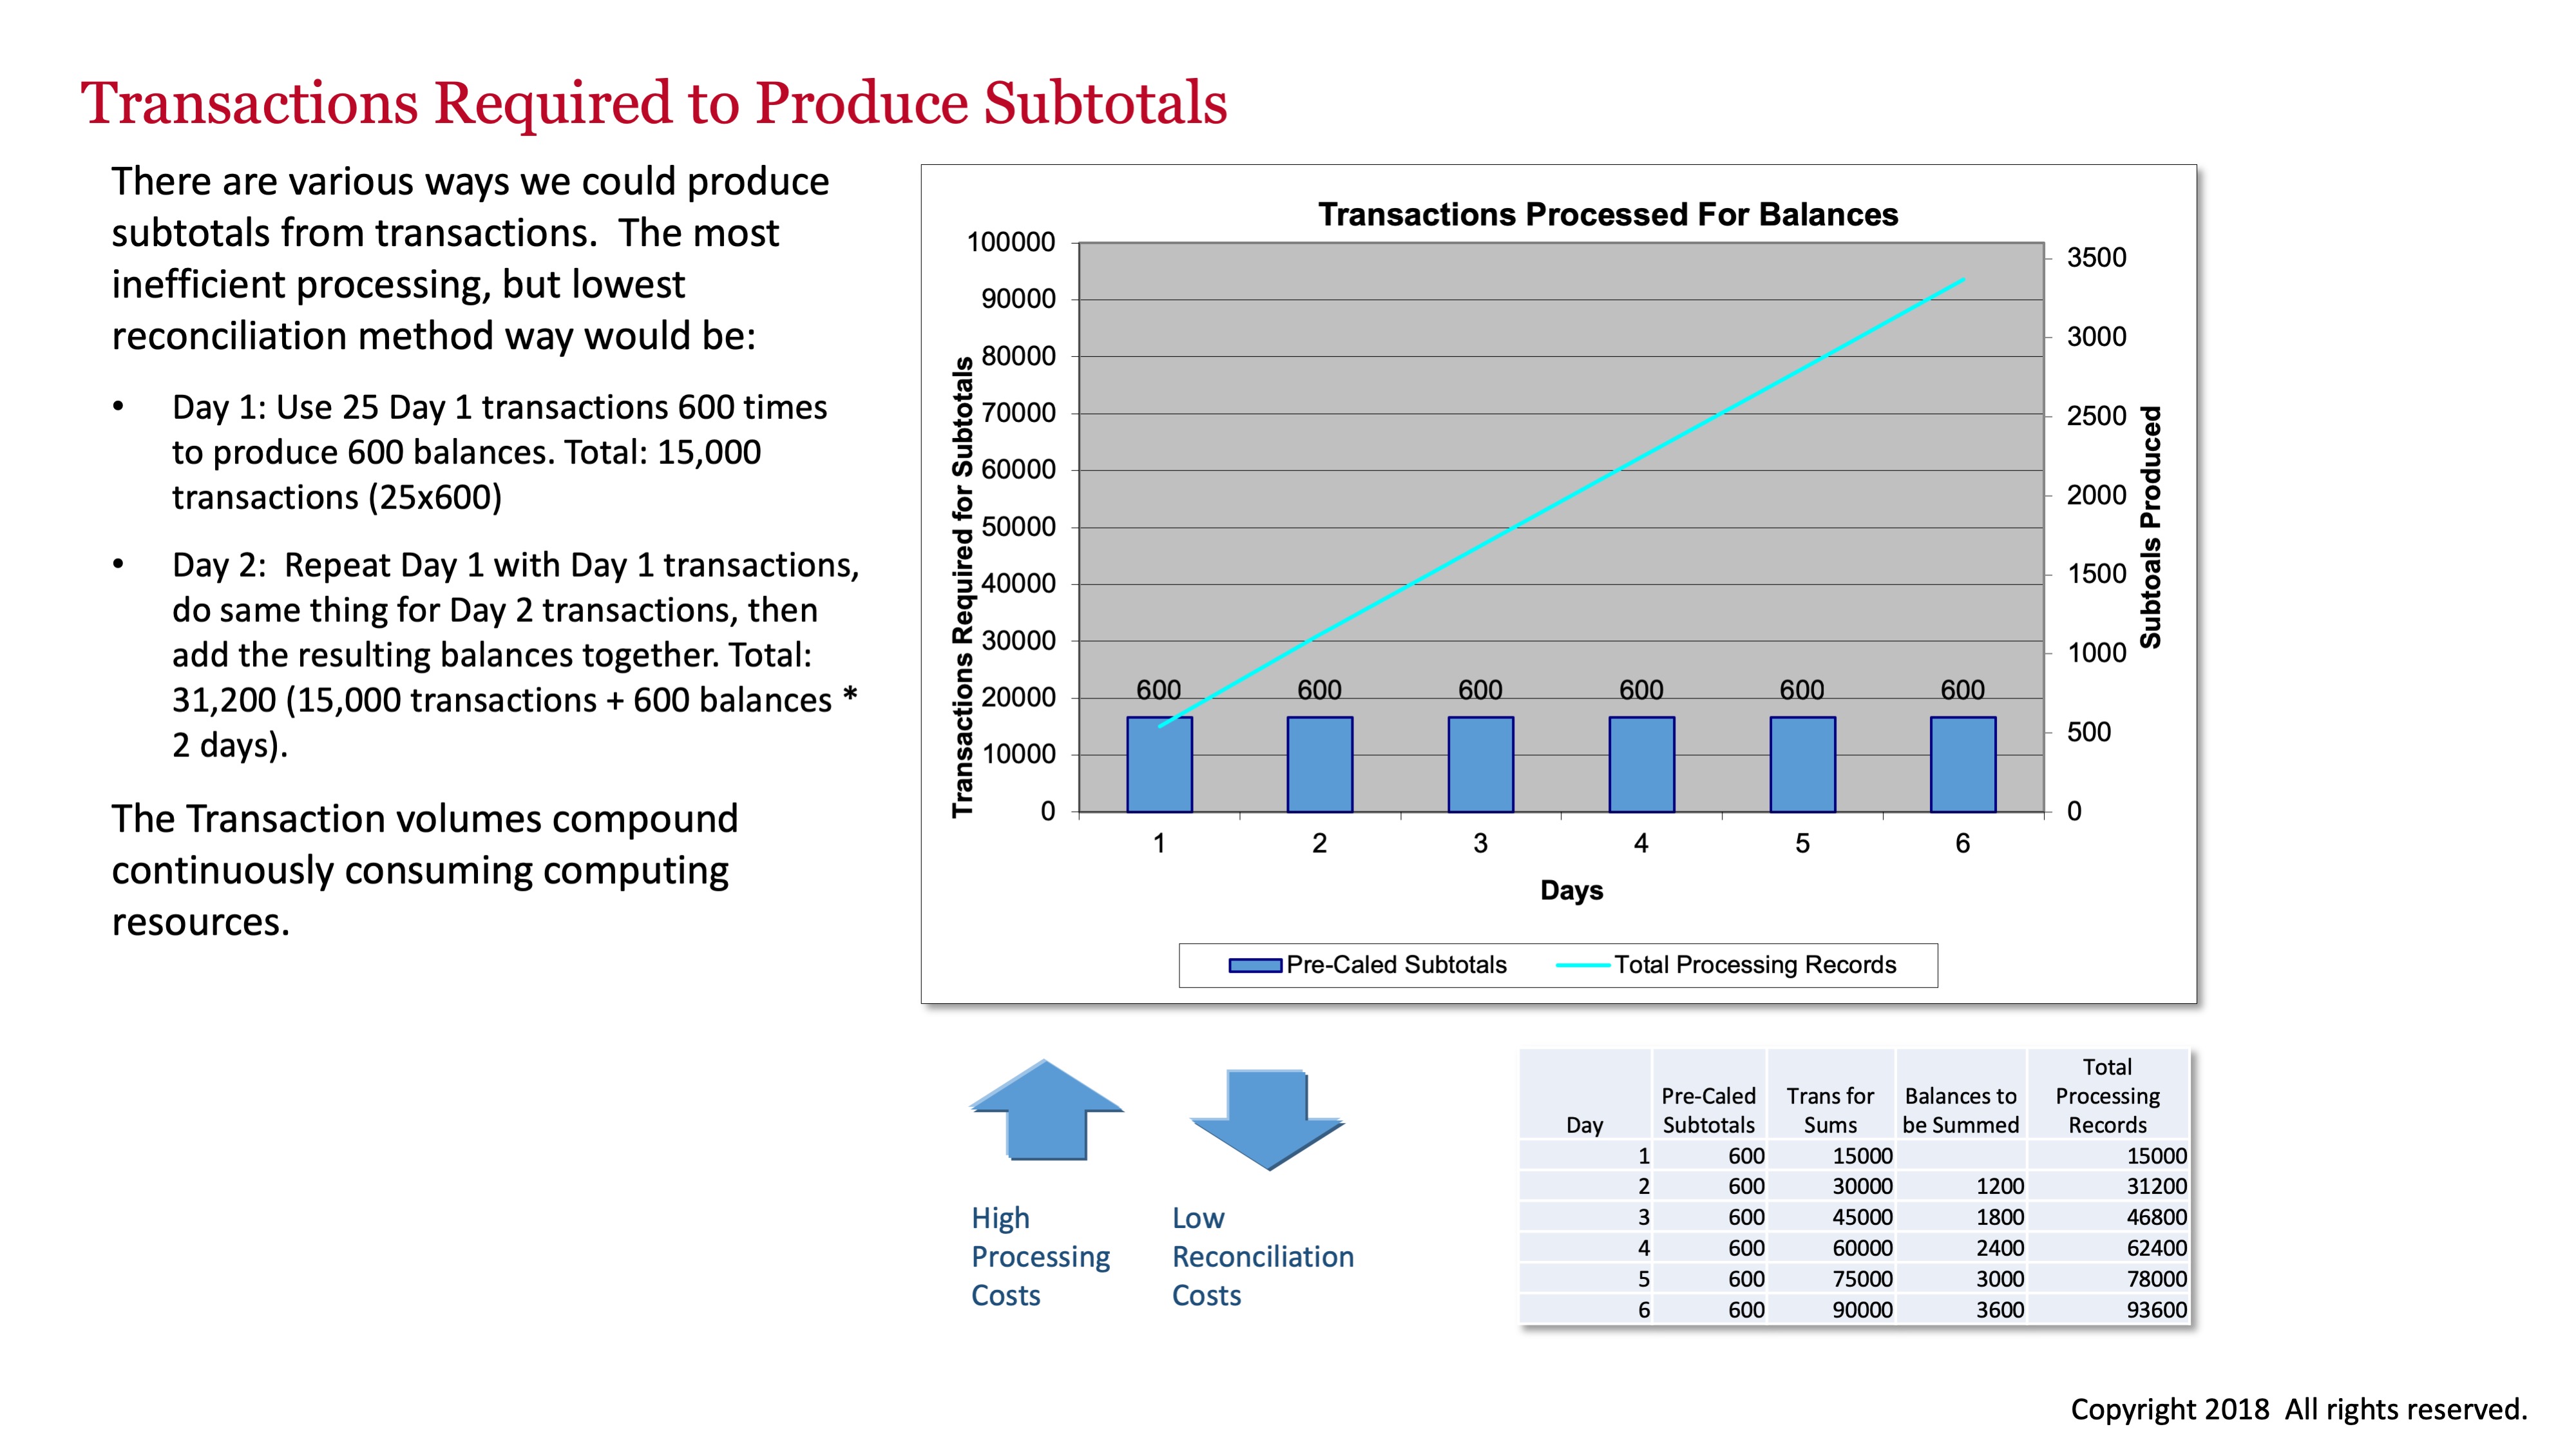
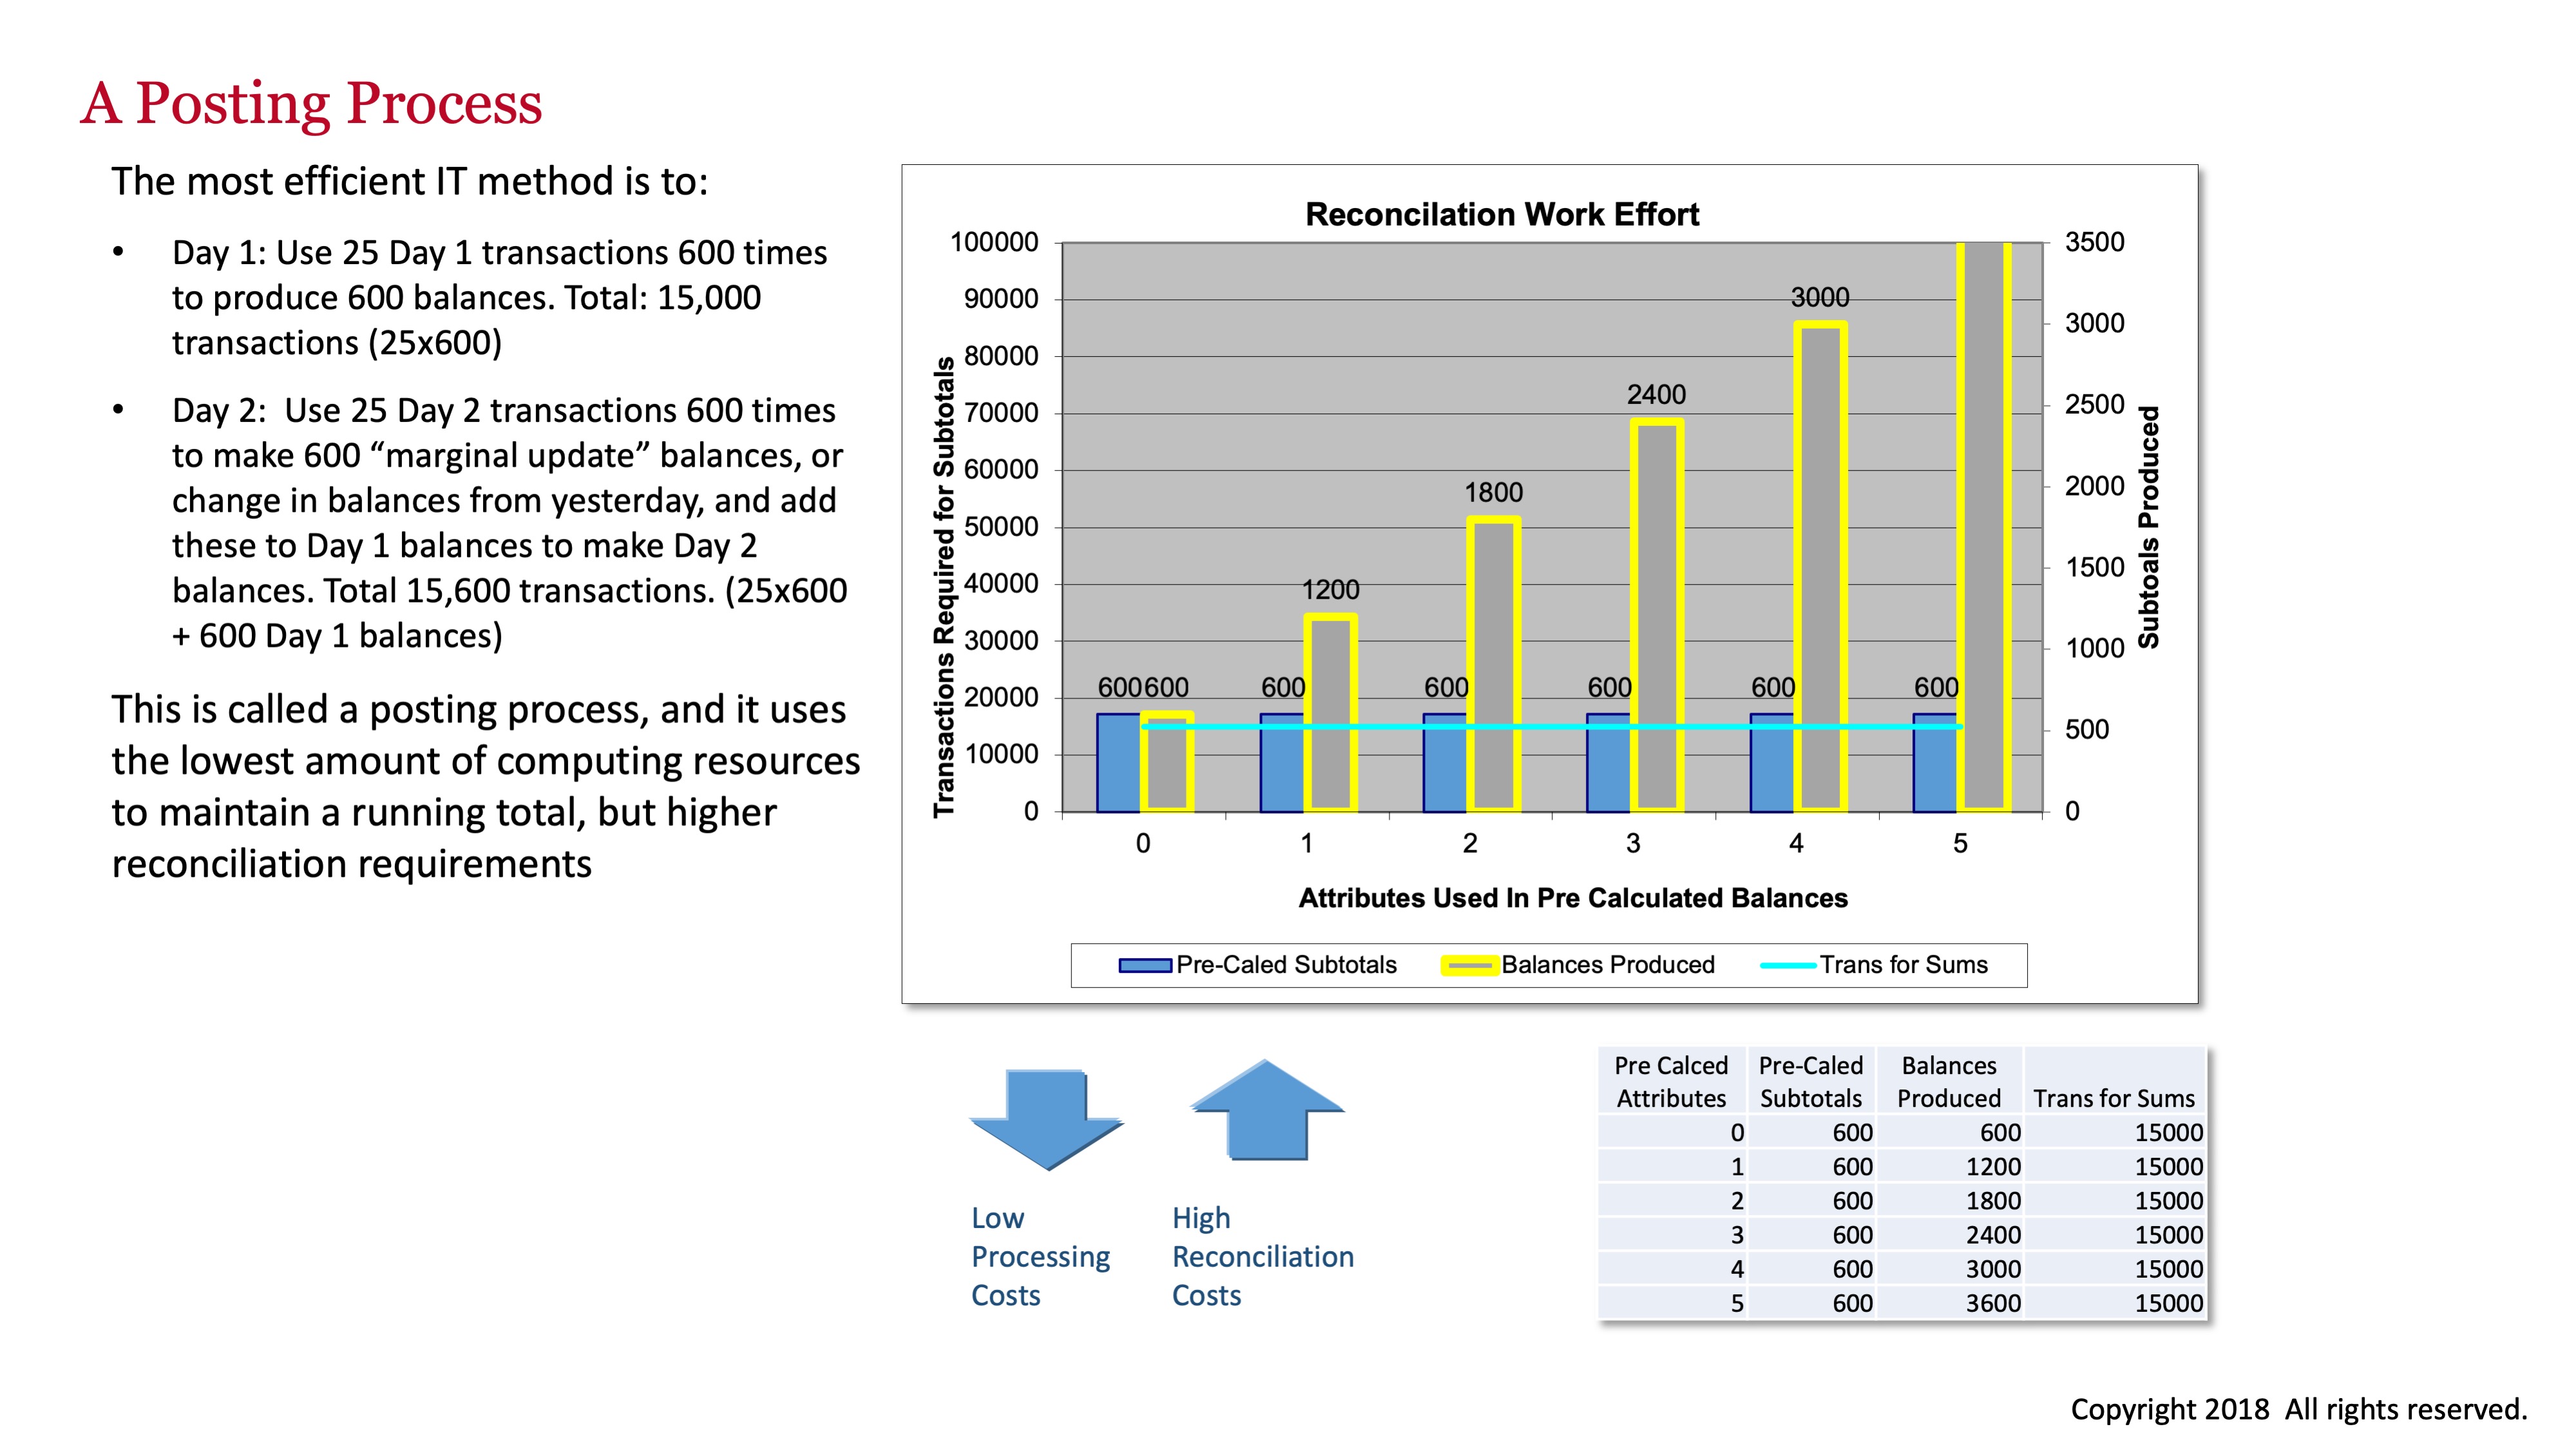
The following charts show the relationship between transactions and balances, and the impact upon analytical processes of using each. They also show how the production of balances (typically in an existing Data Supply Chain) affects the daily Financial Cycle of almost all organizations.

Consistency of Data Structures
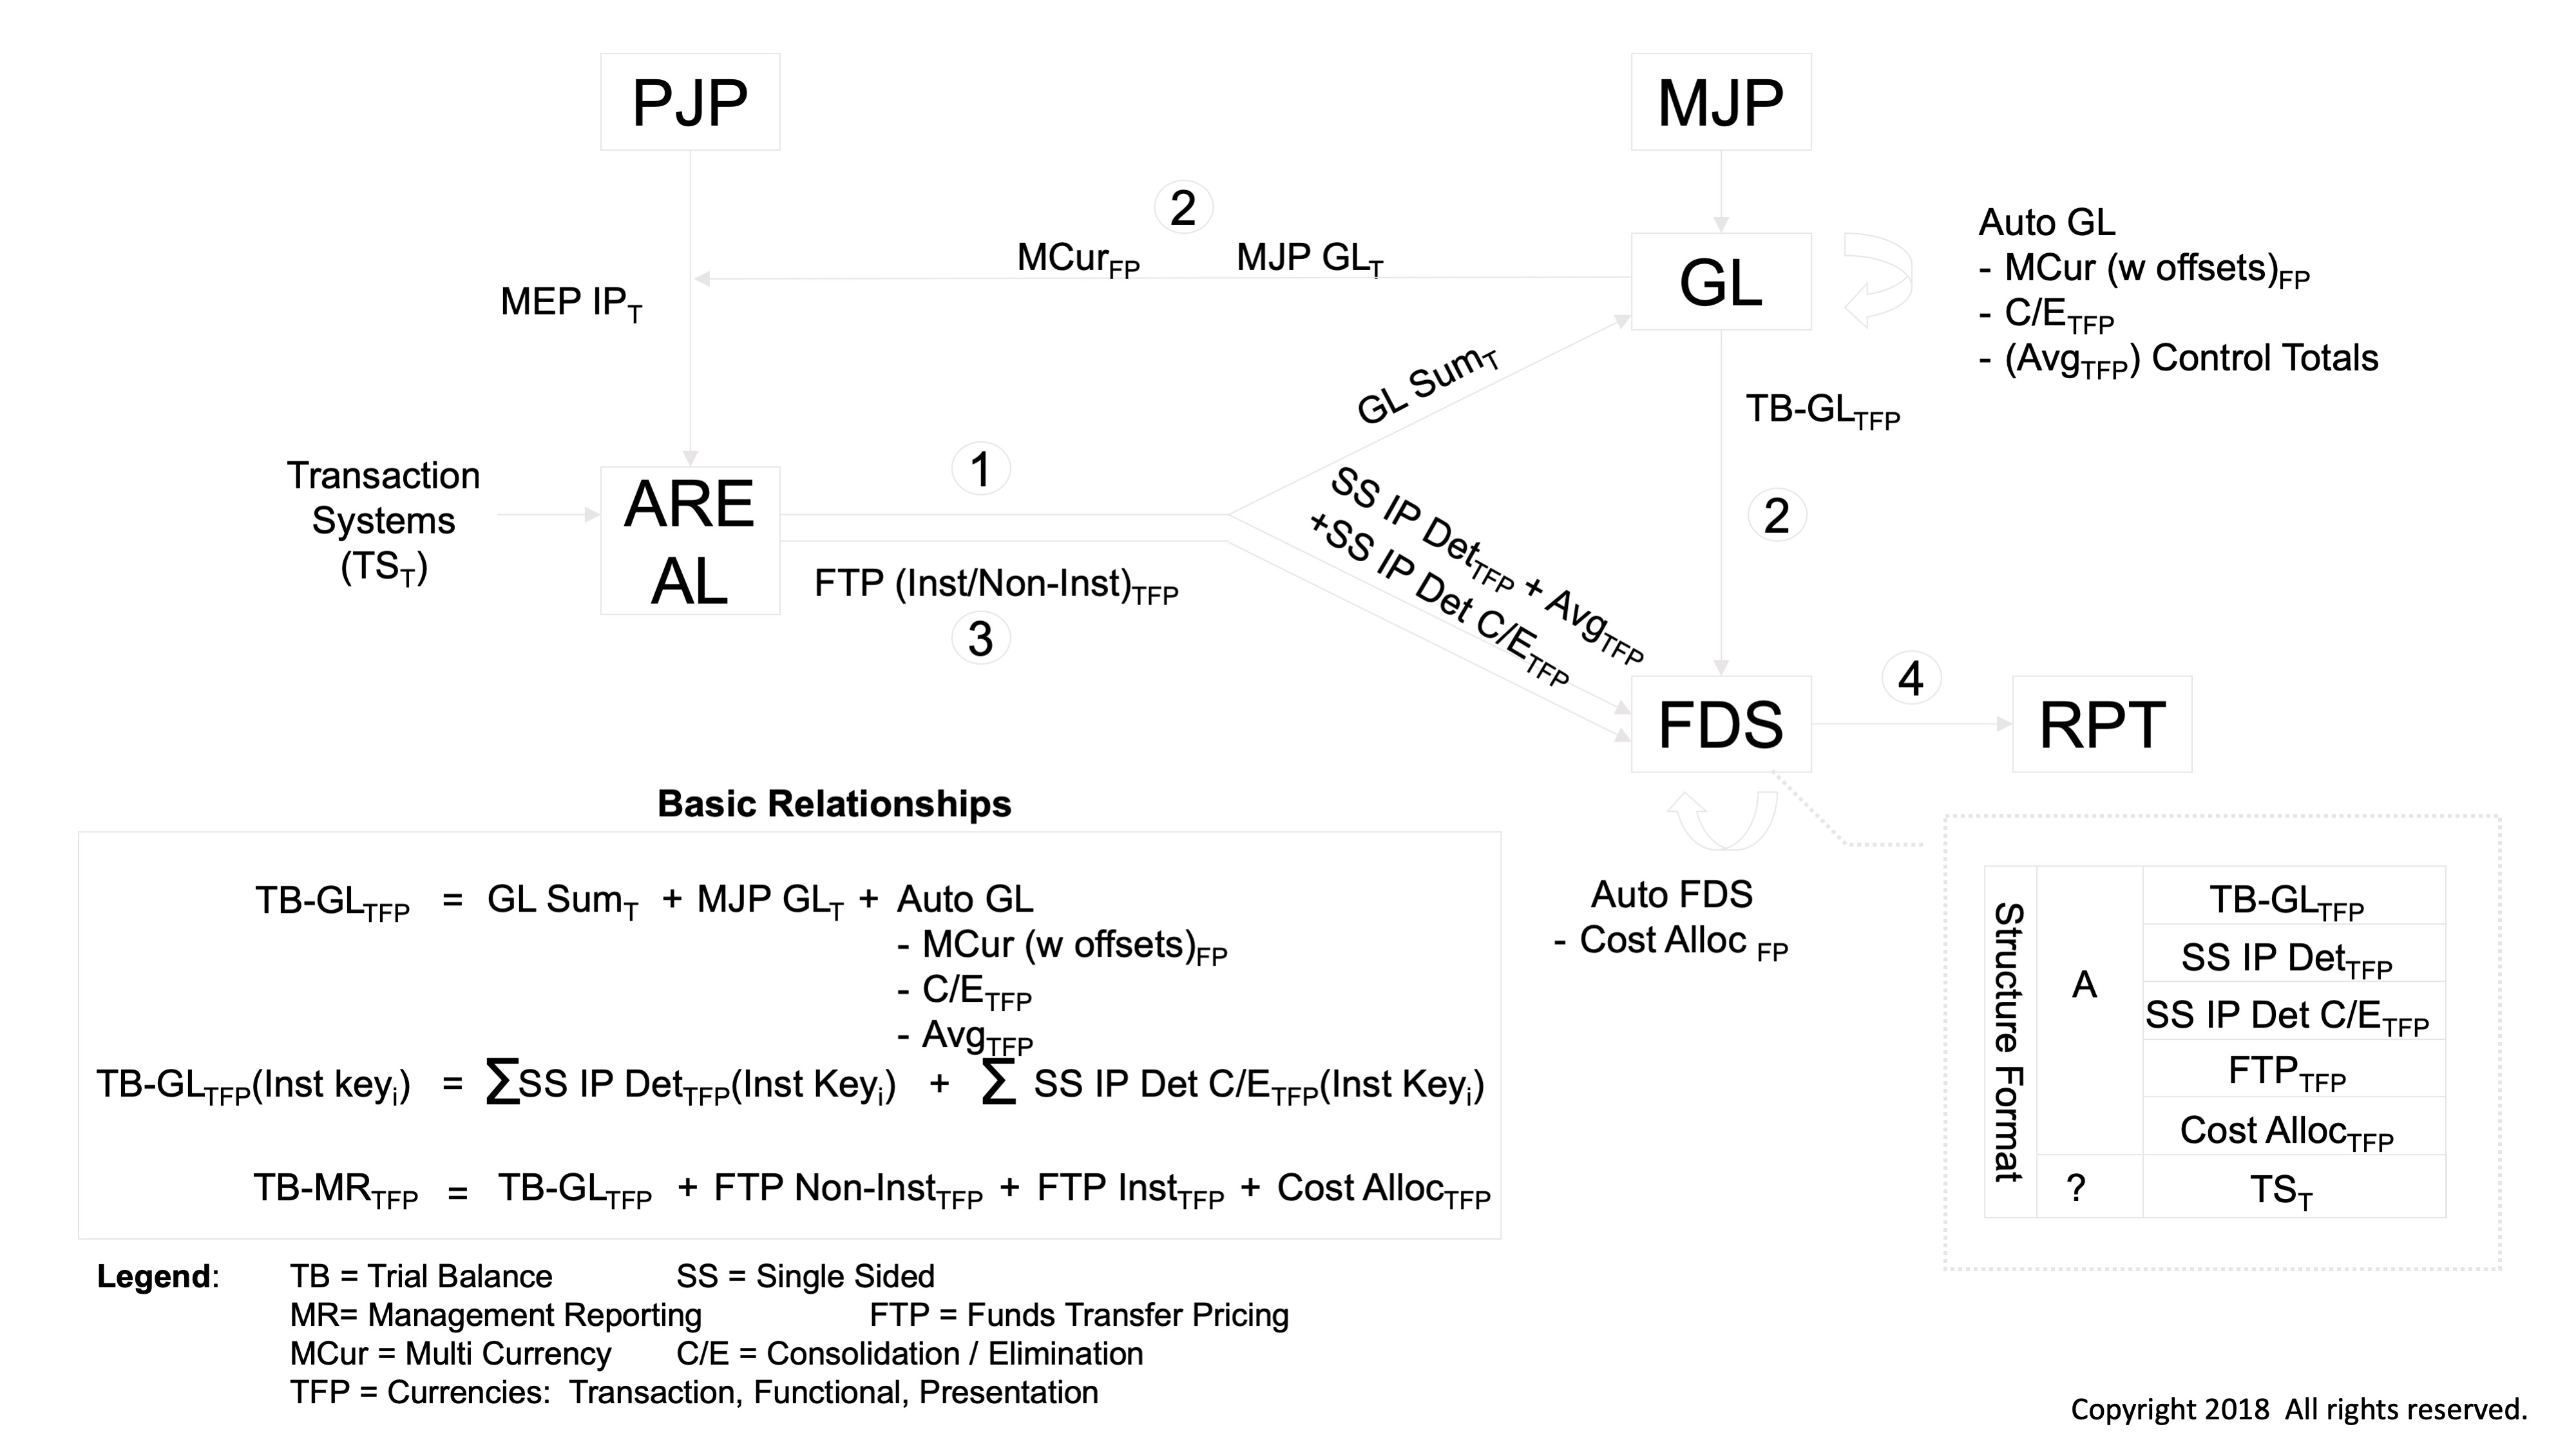
Differing data structures can drive tremendous complexity in data supply chains. The finance systems demonstrates it is possible to consolidate data into a single structure, as is done today in the financial system trial balance. This graph was used to demonstrate to a customer how a system could be constructed which brought detailed customer level data together into a consistent structure across all lines of business and all products.
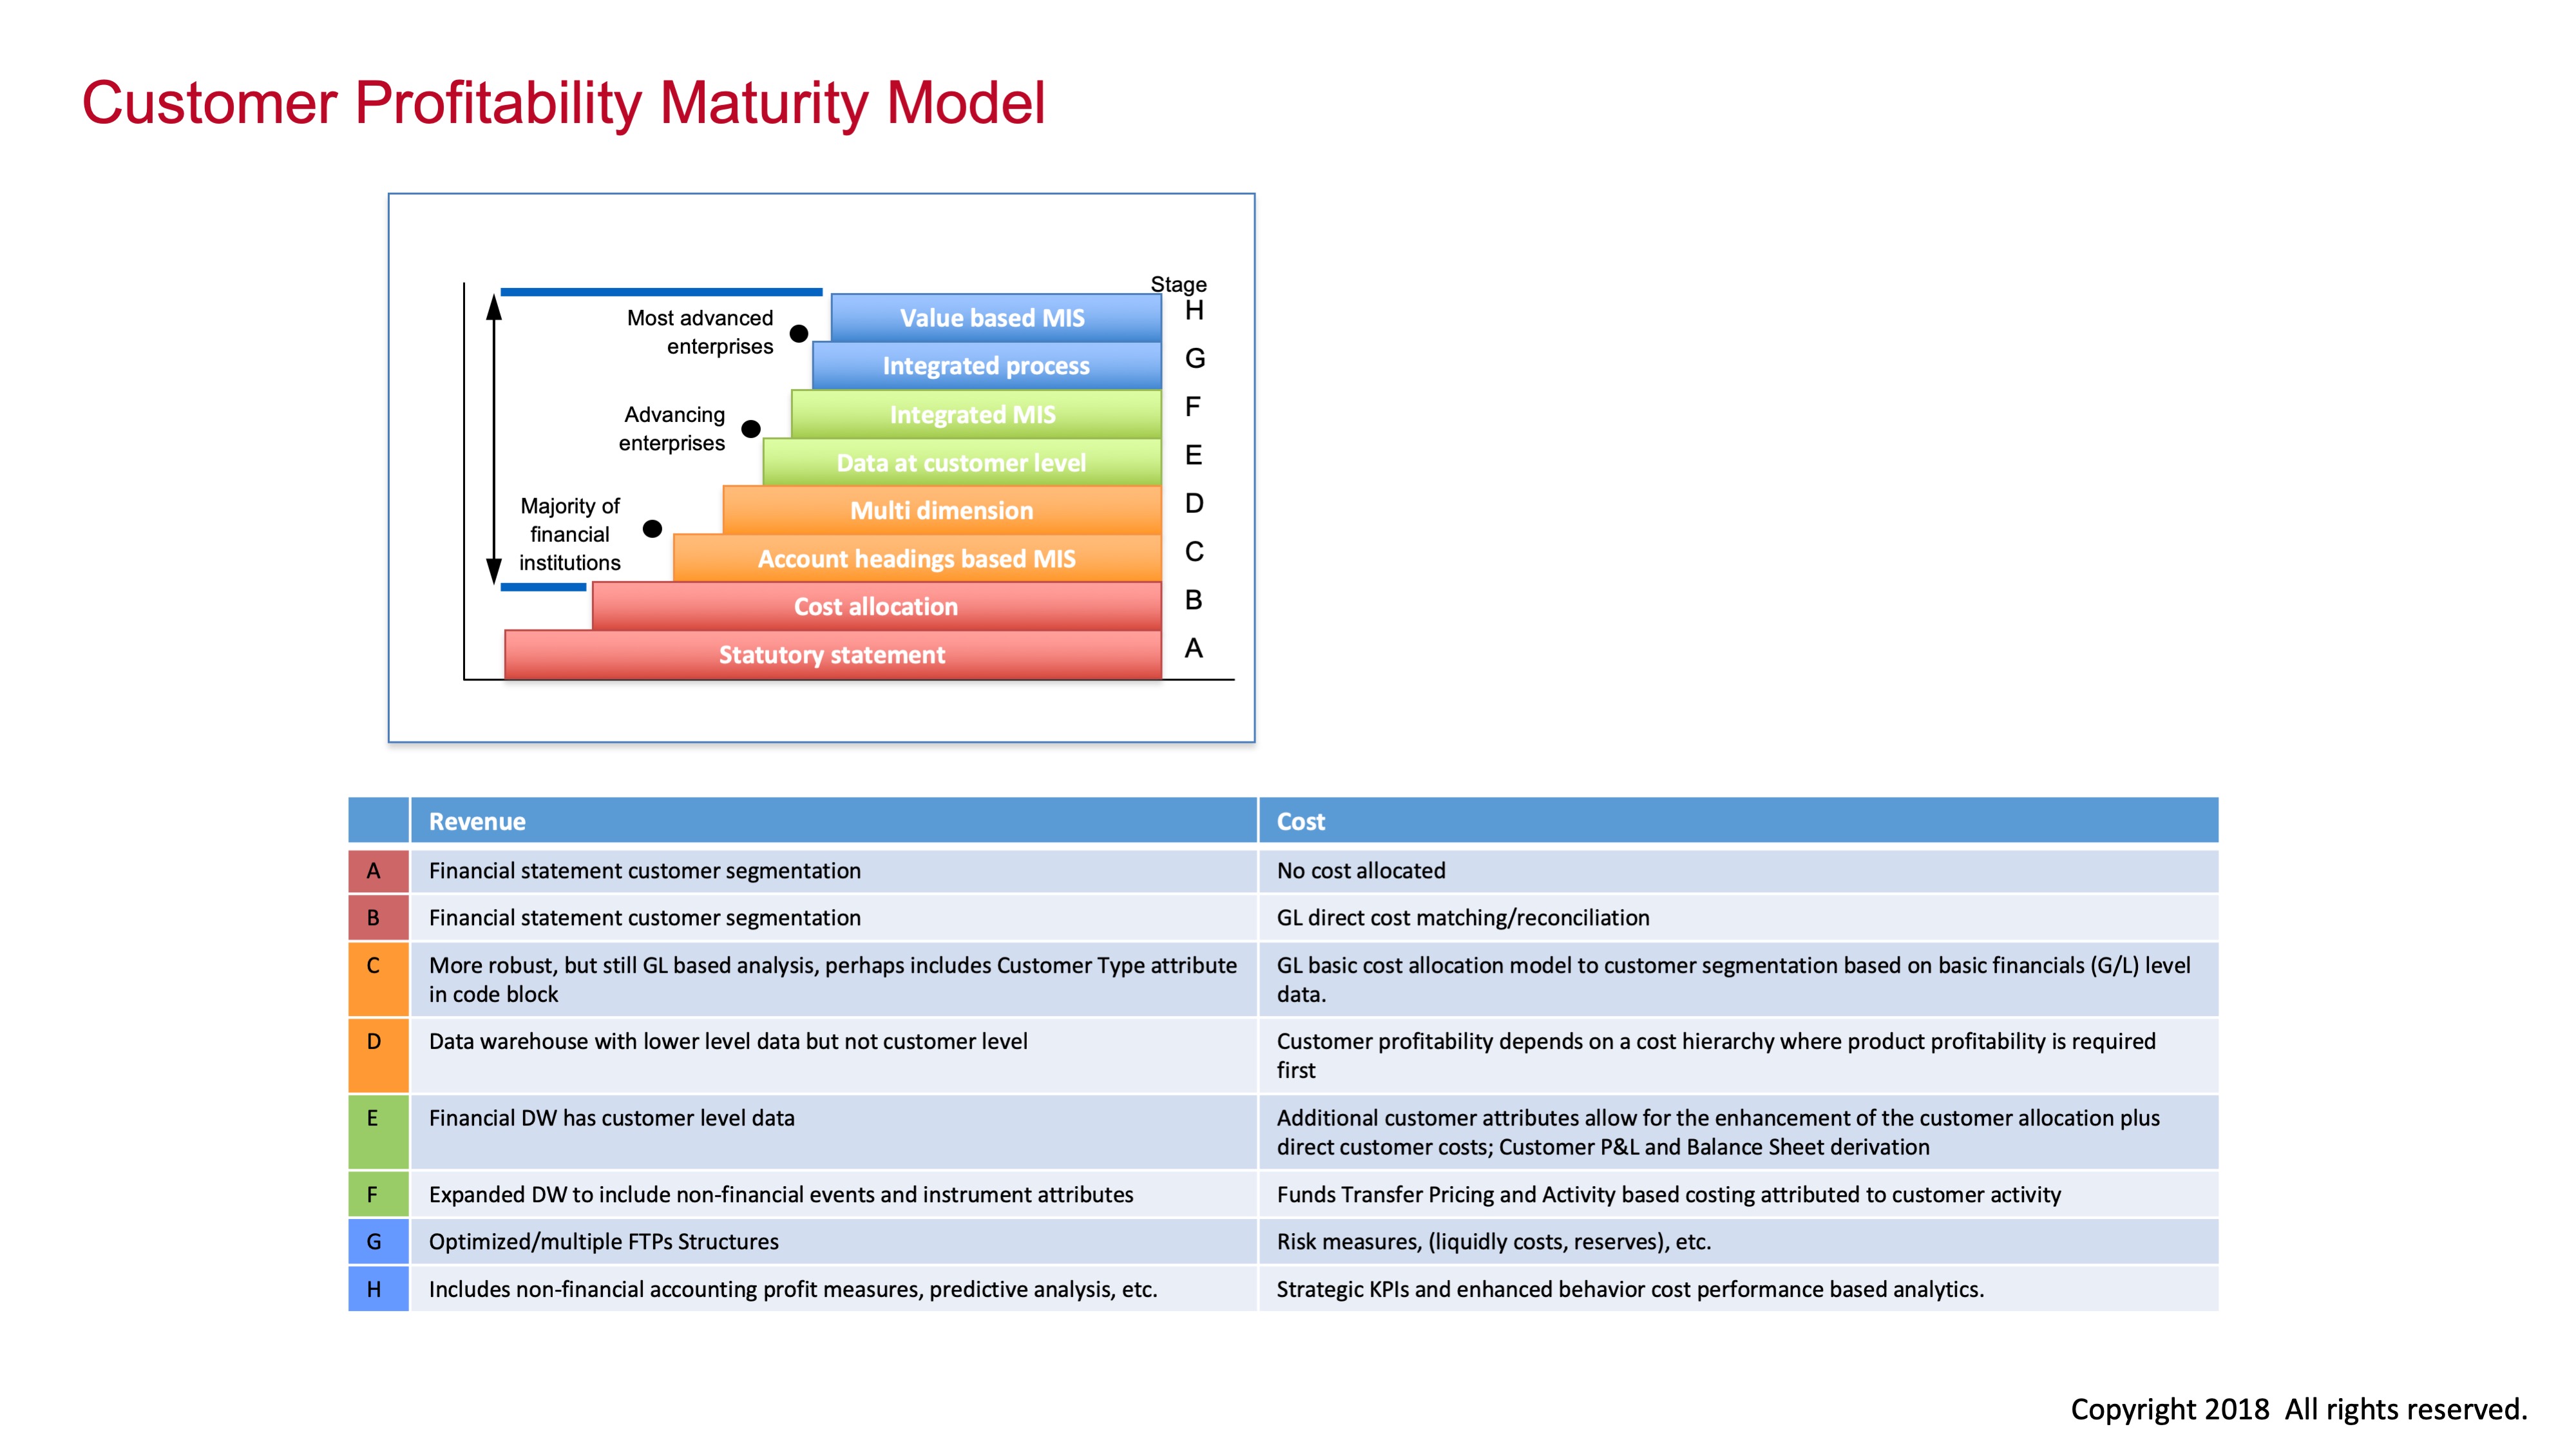
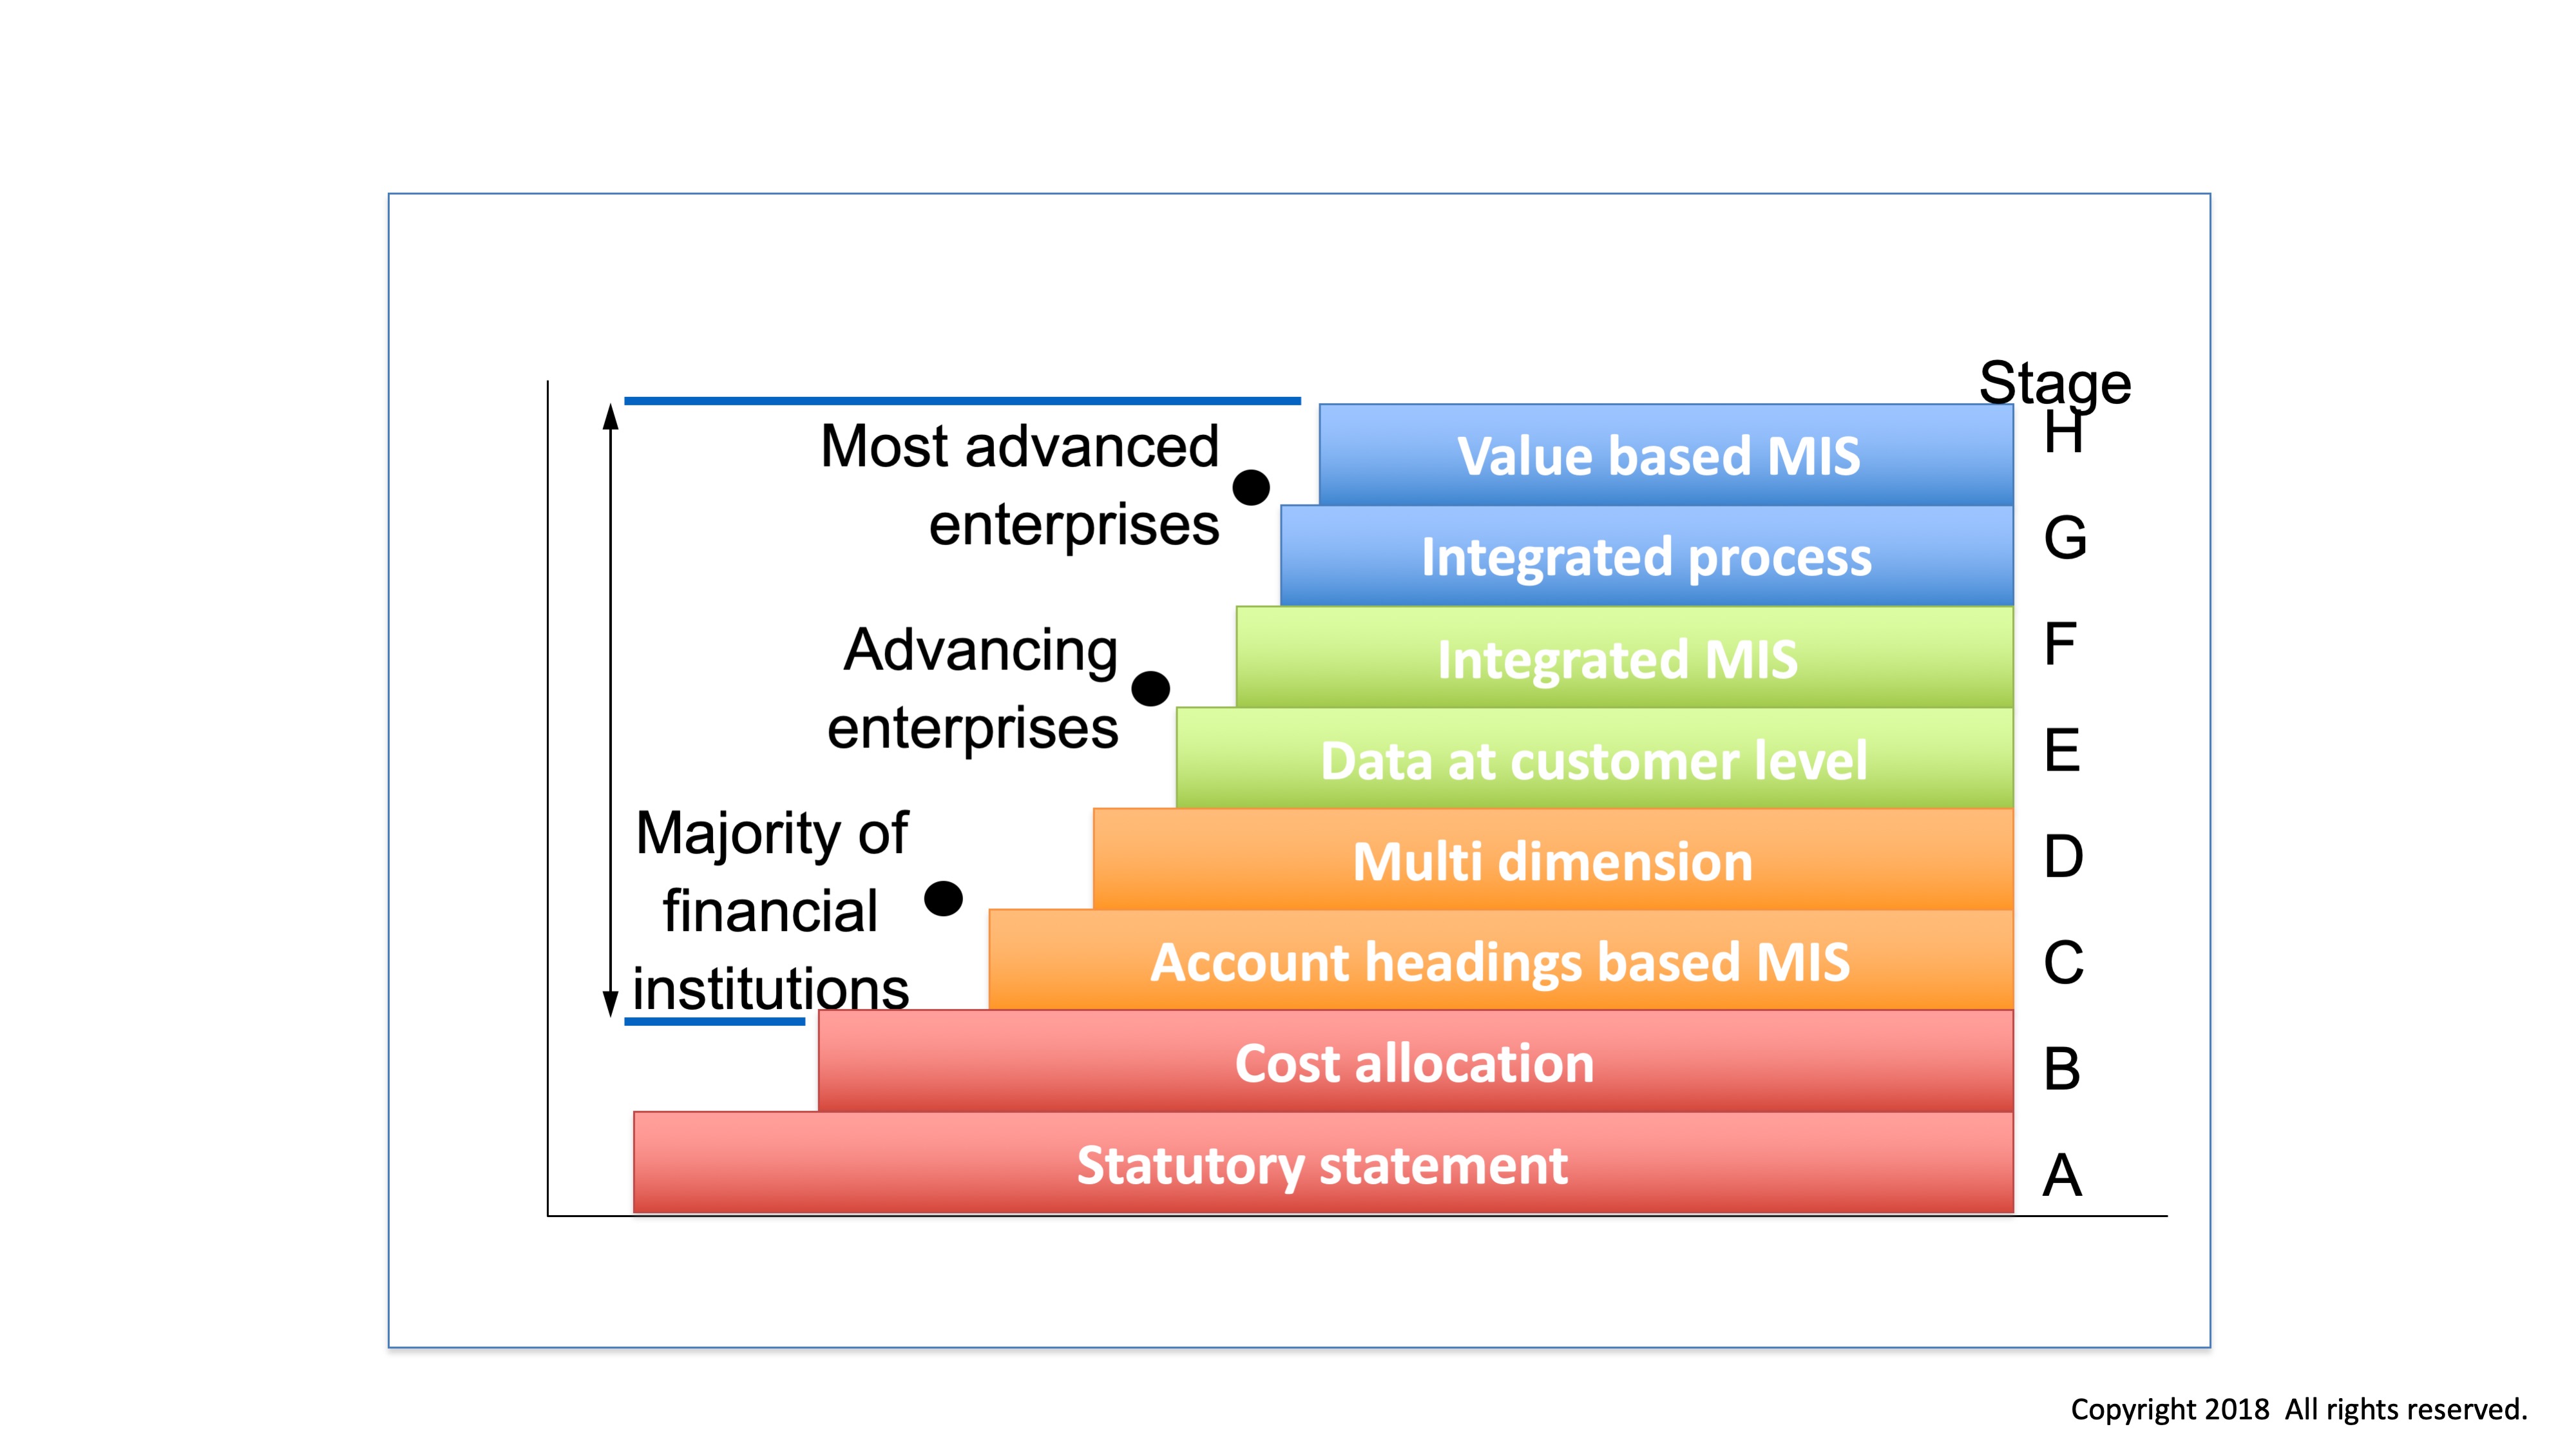
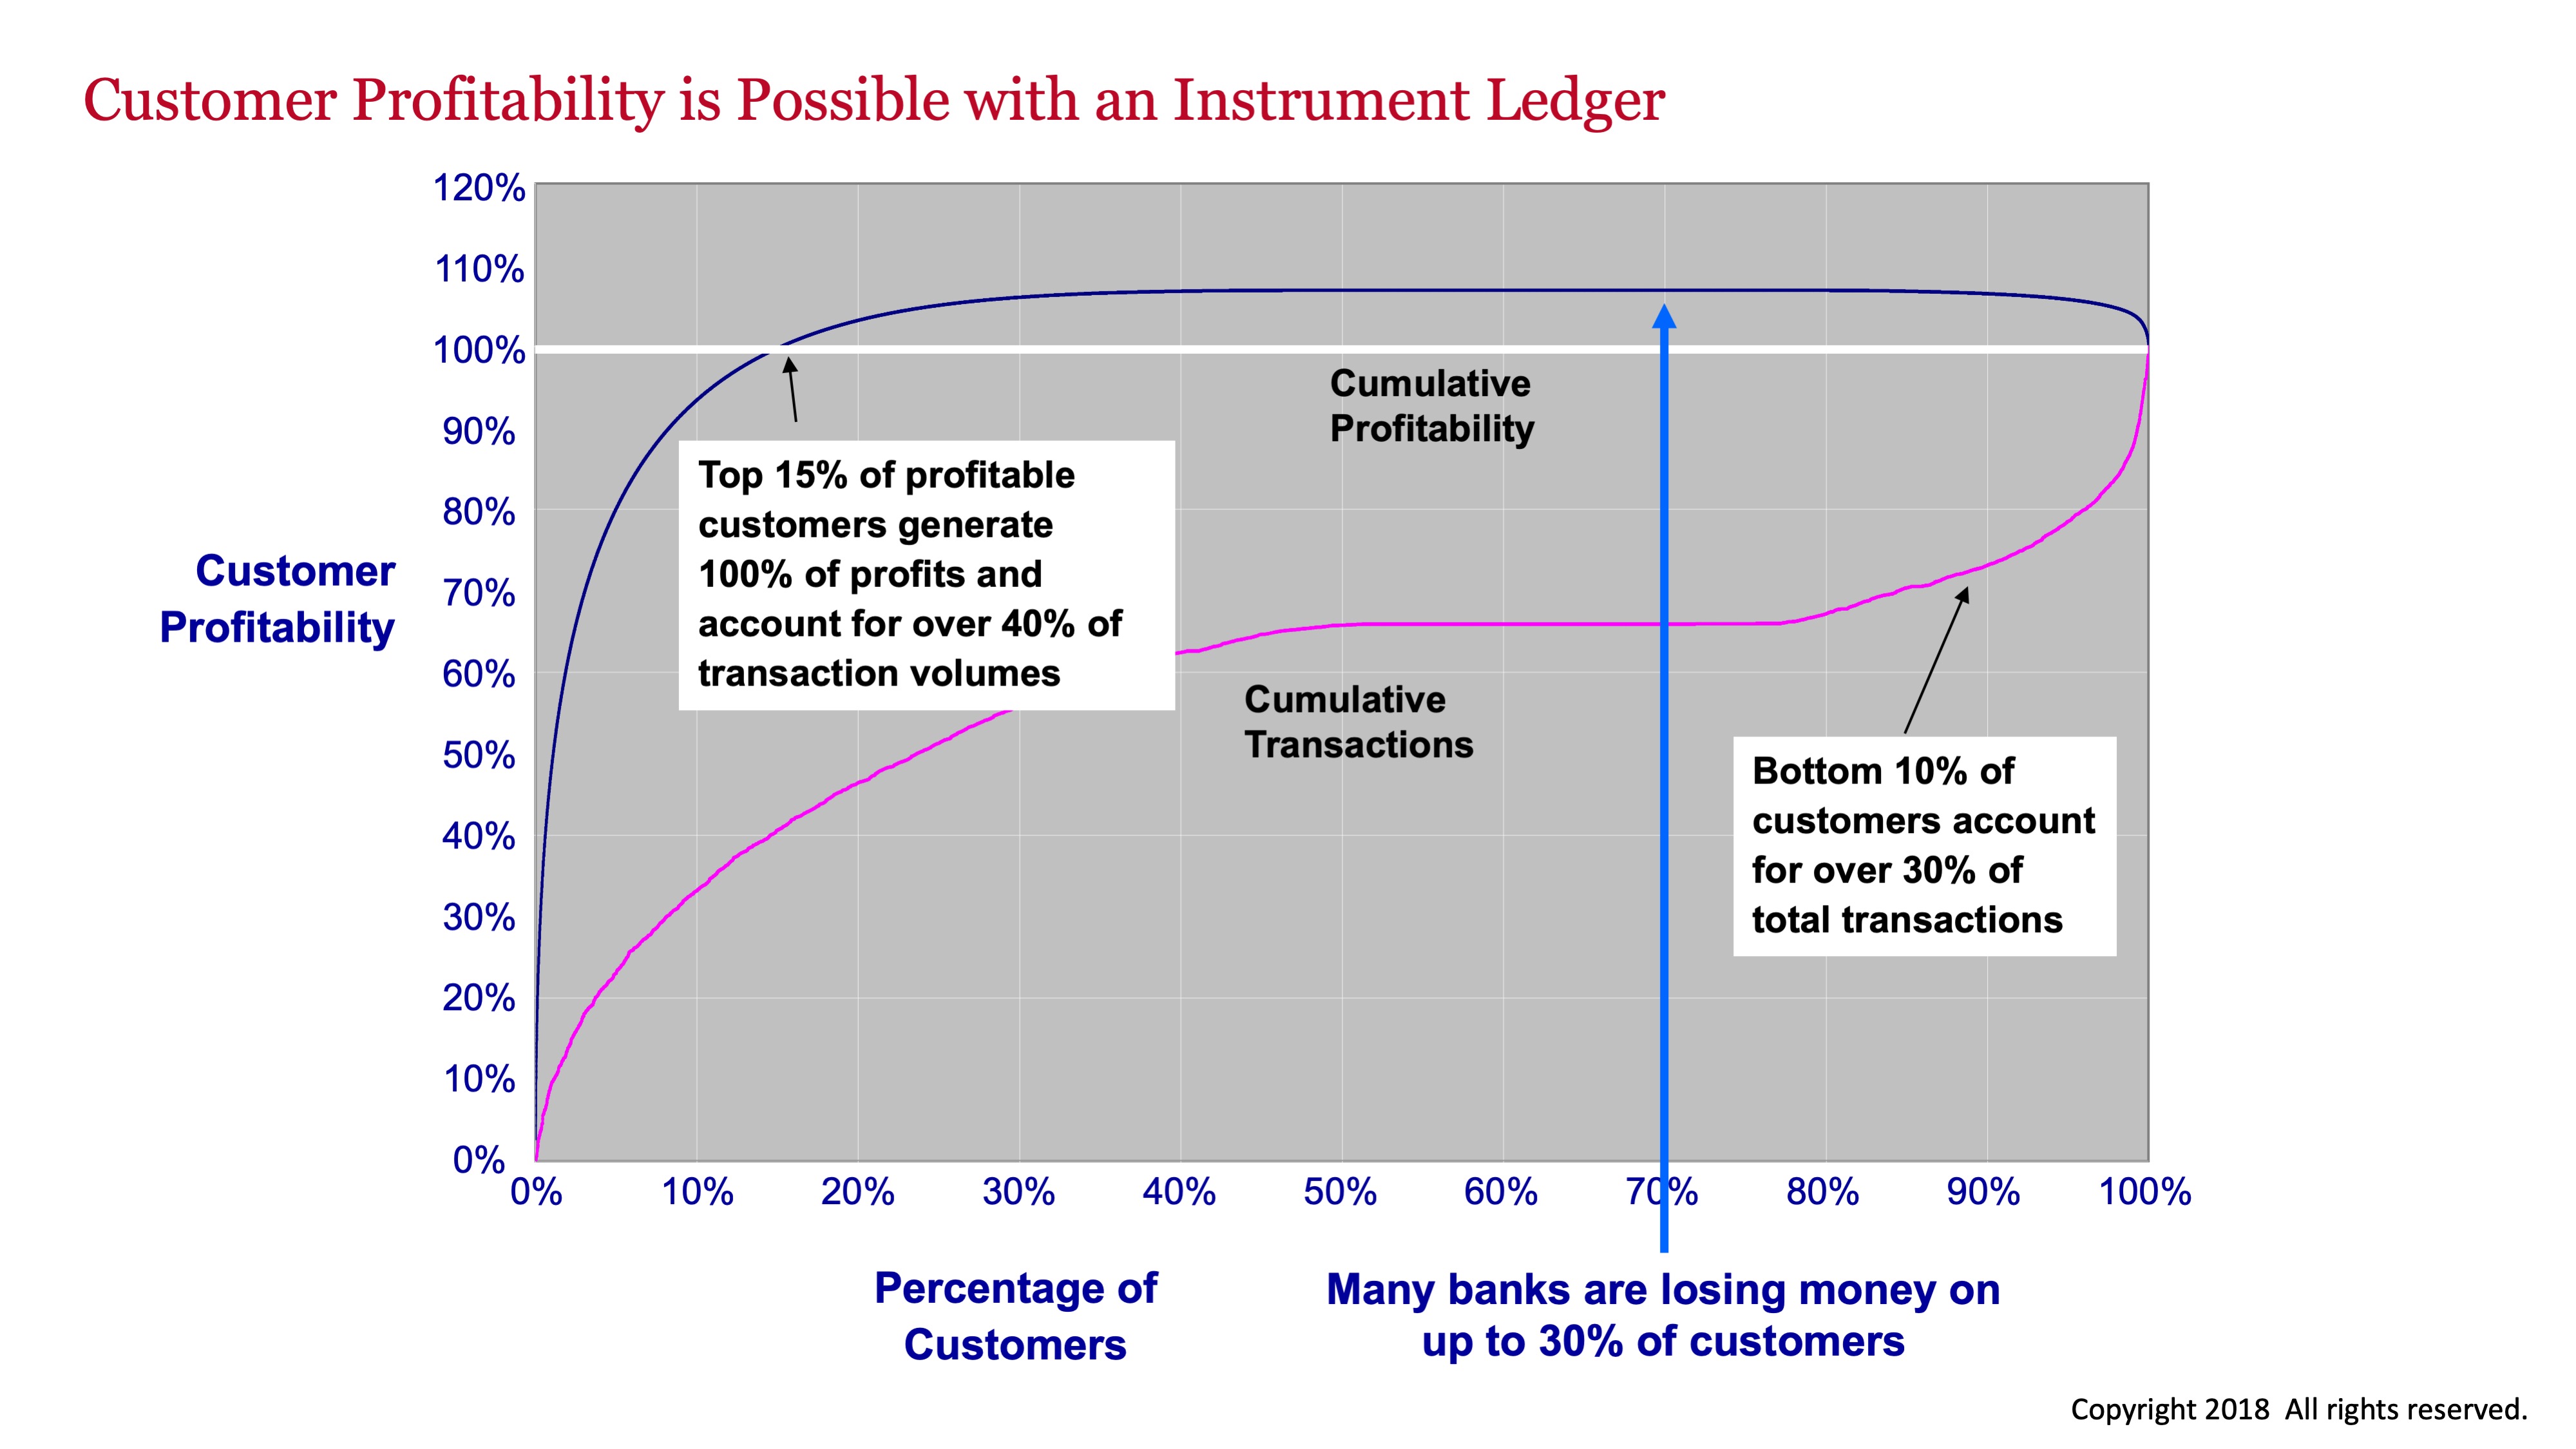
Customer Profitability
The following slides describe a model for assessing maturity of customer profitability processes.
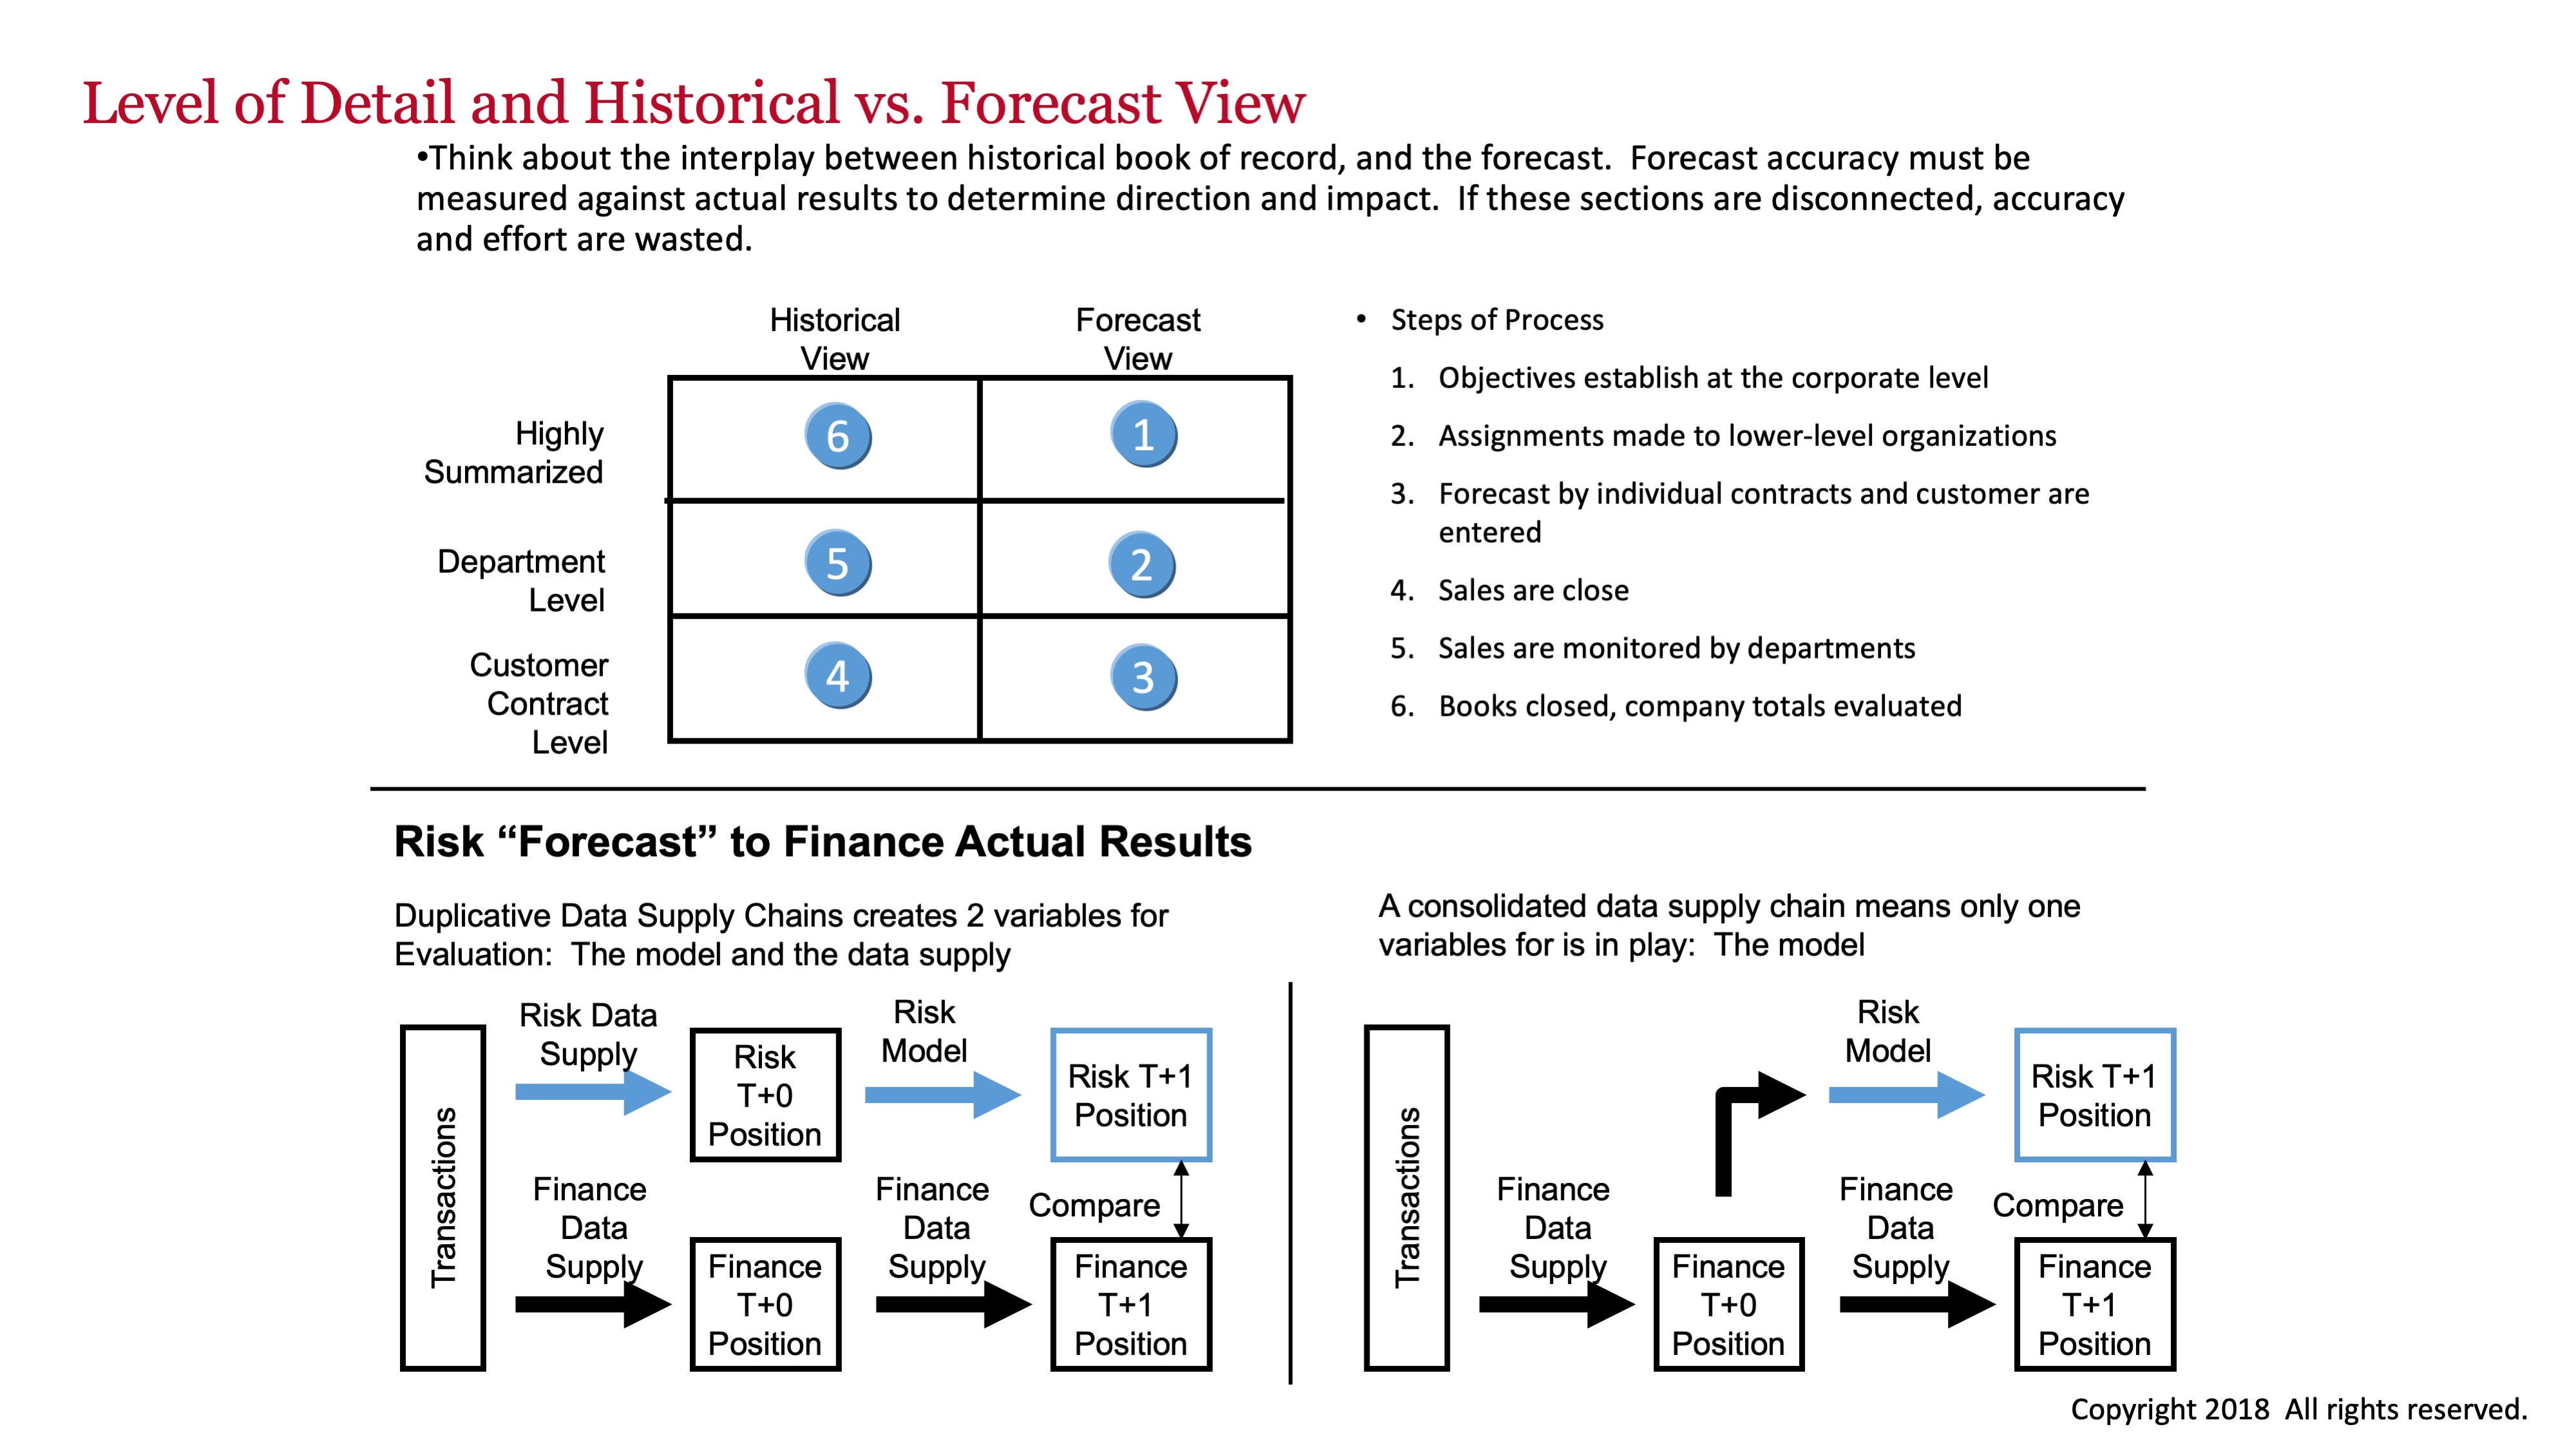
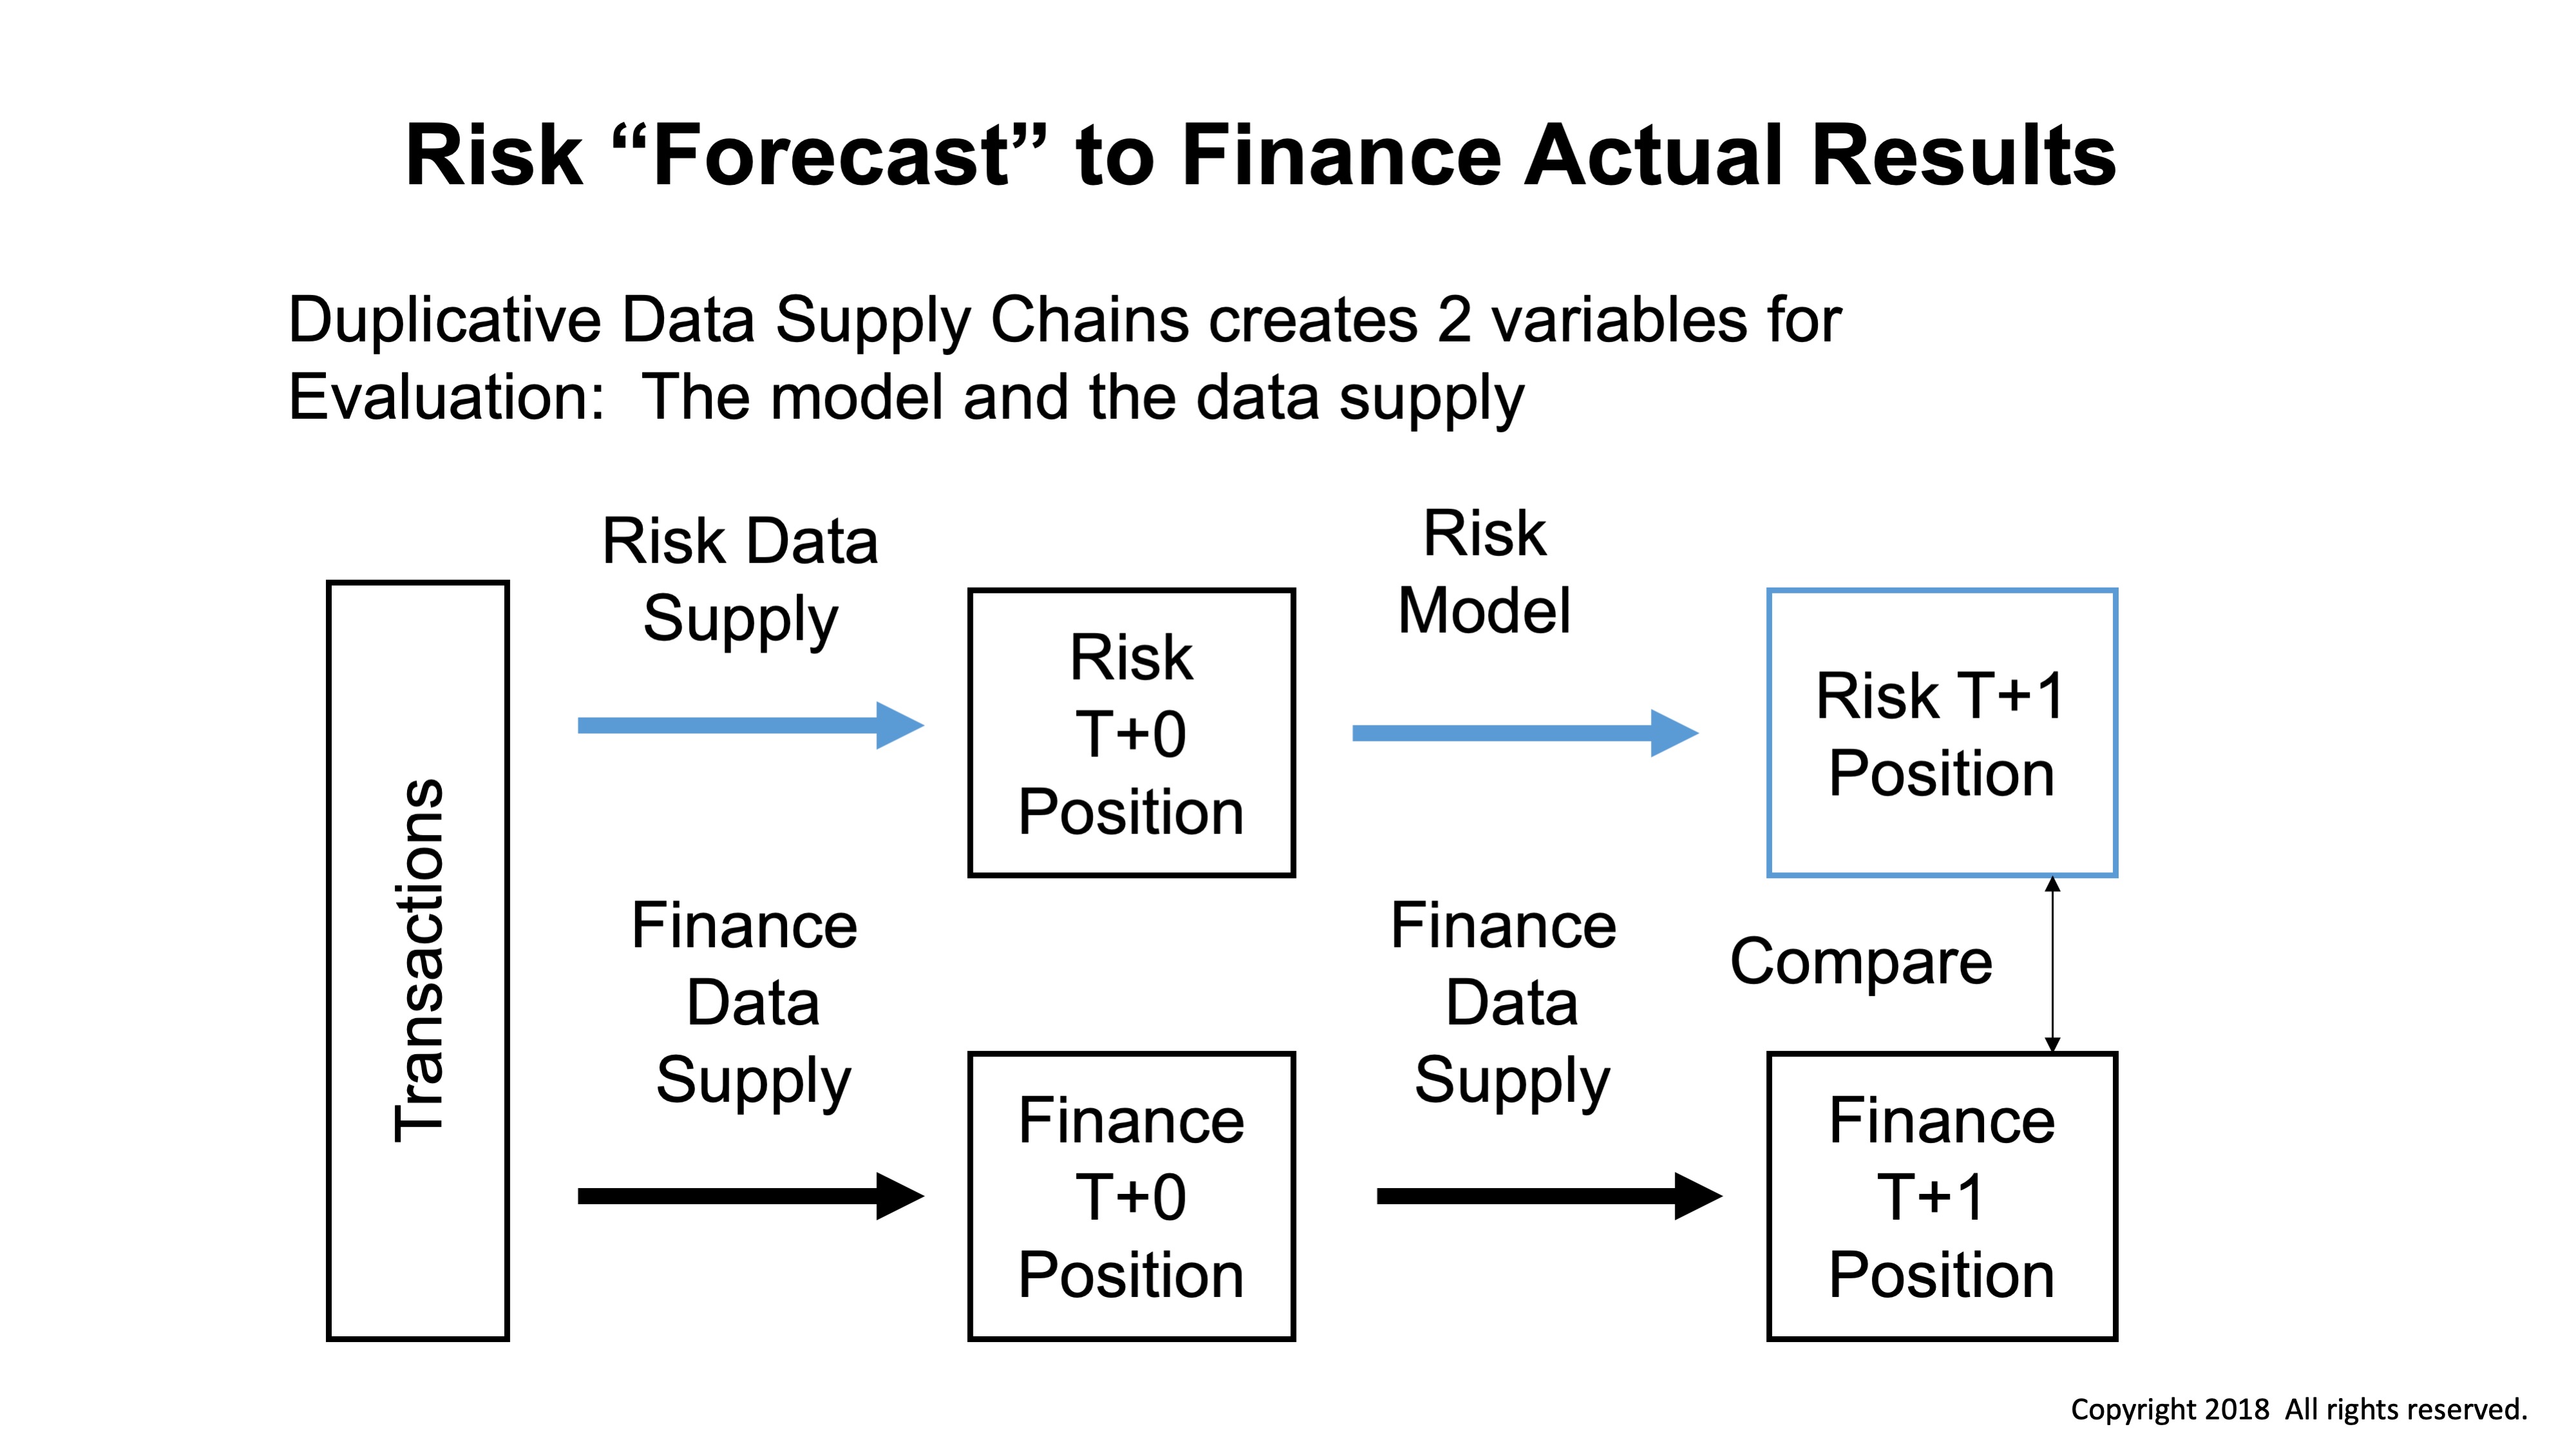
Finance and Risk Data Integration
The following slides demonstrate the interaction between finance and risk data, highlighting some of the key elements that can be used to integrate the two data supply chains, but also highlighting the key differences between them.


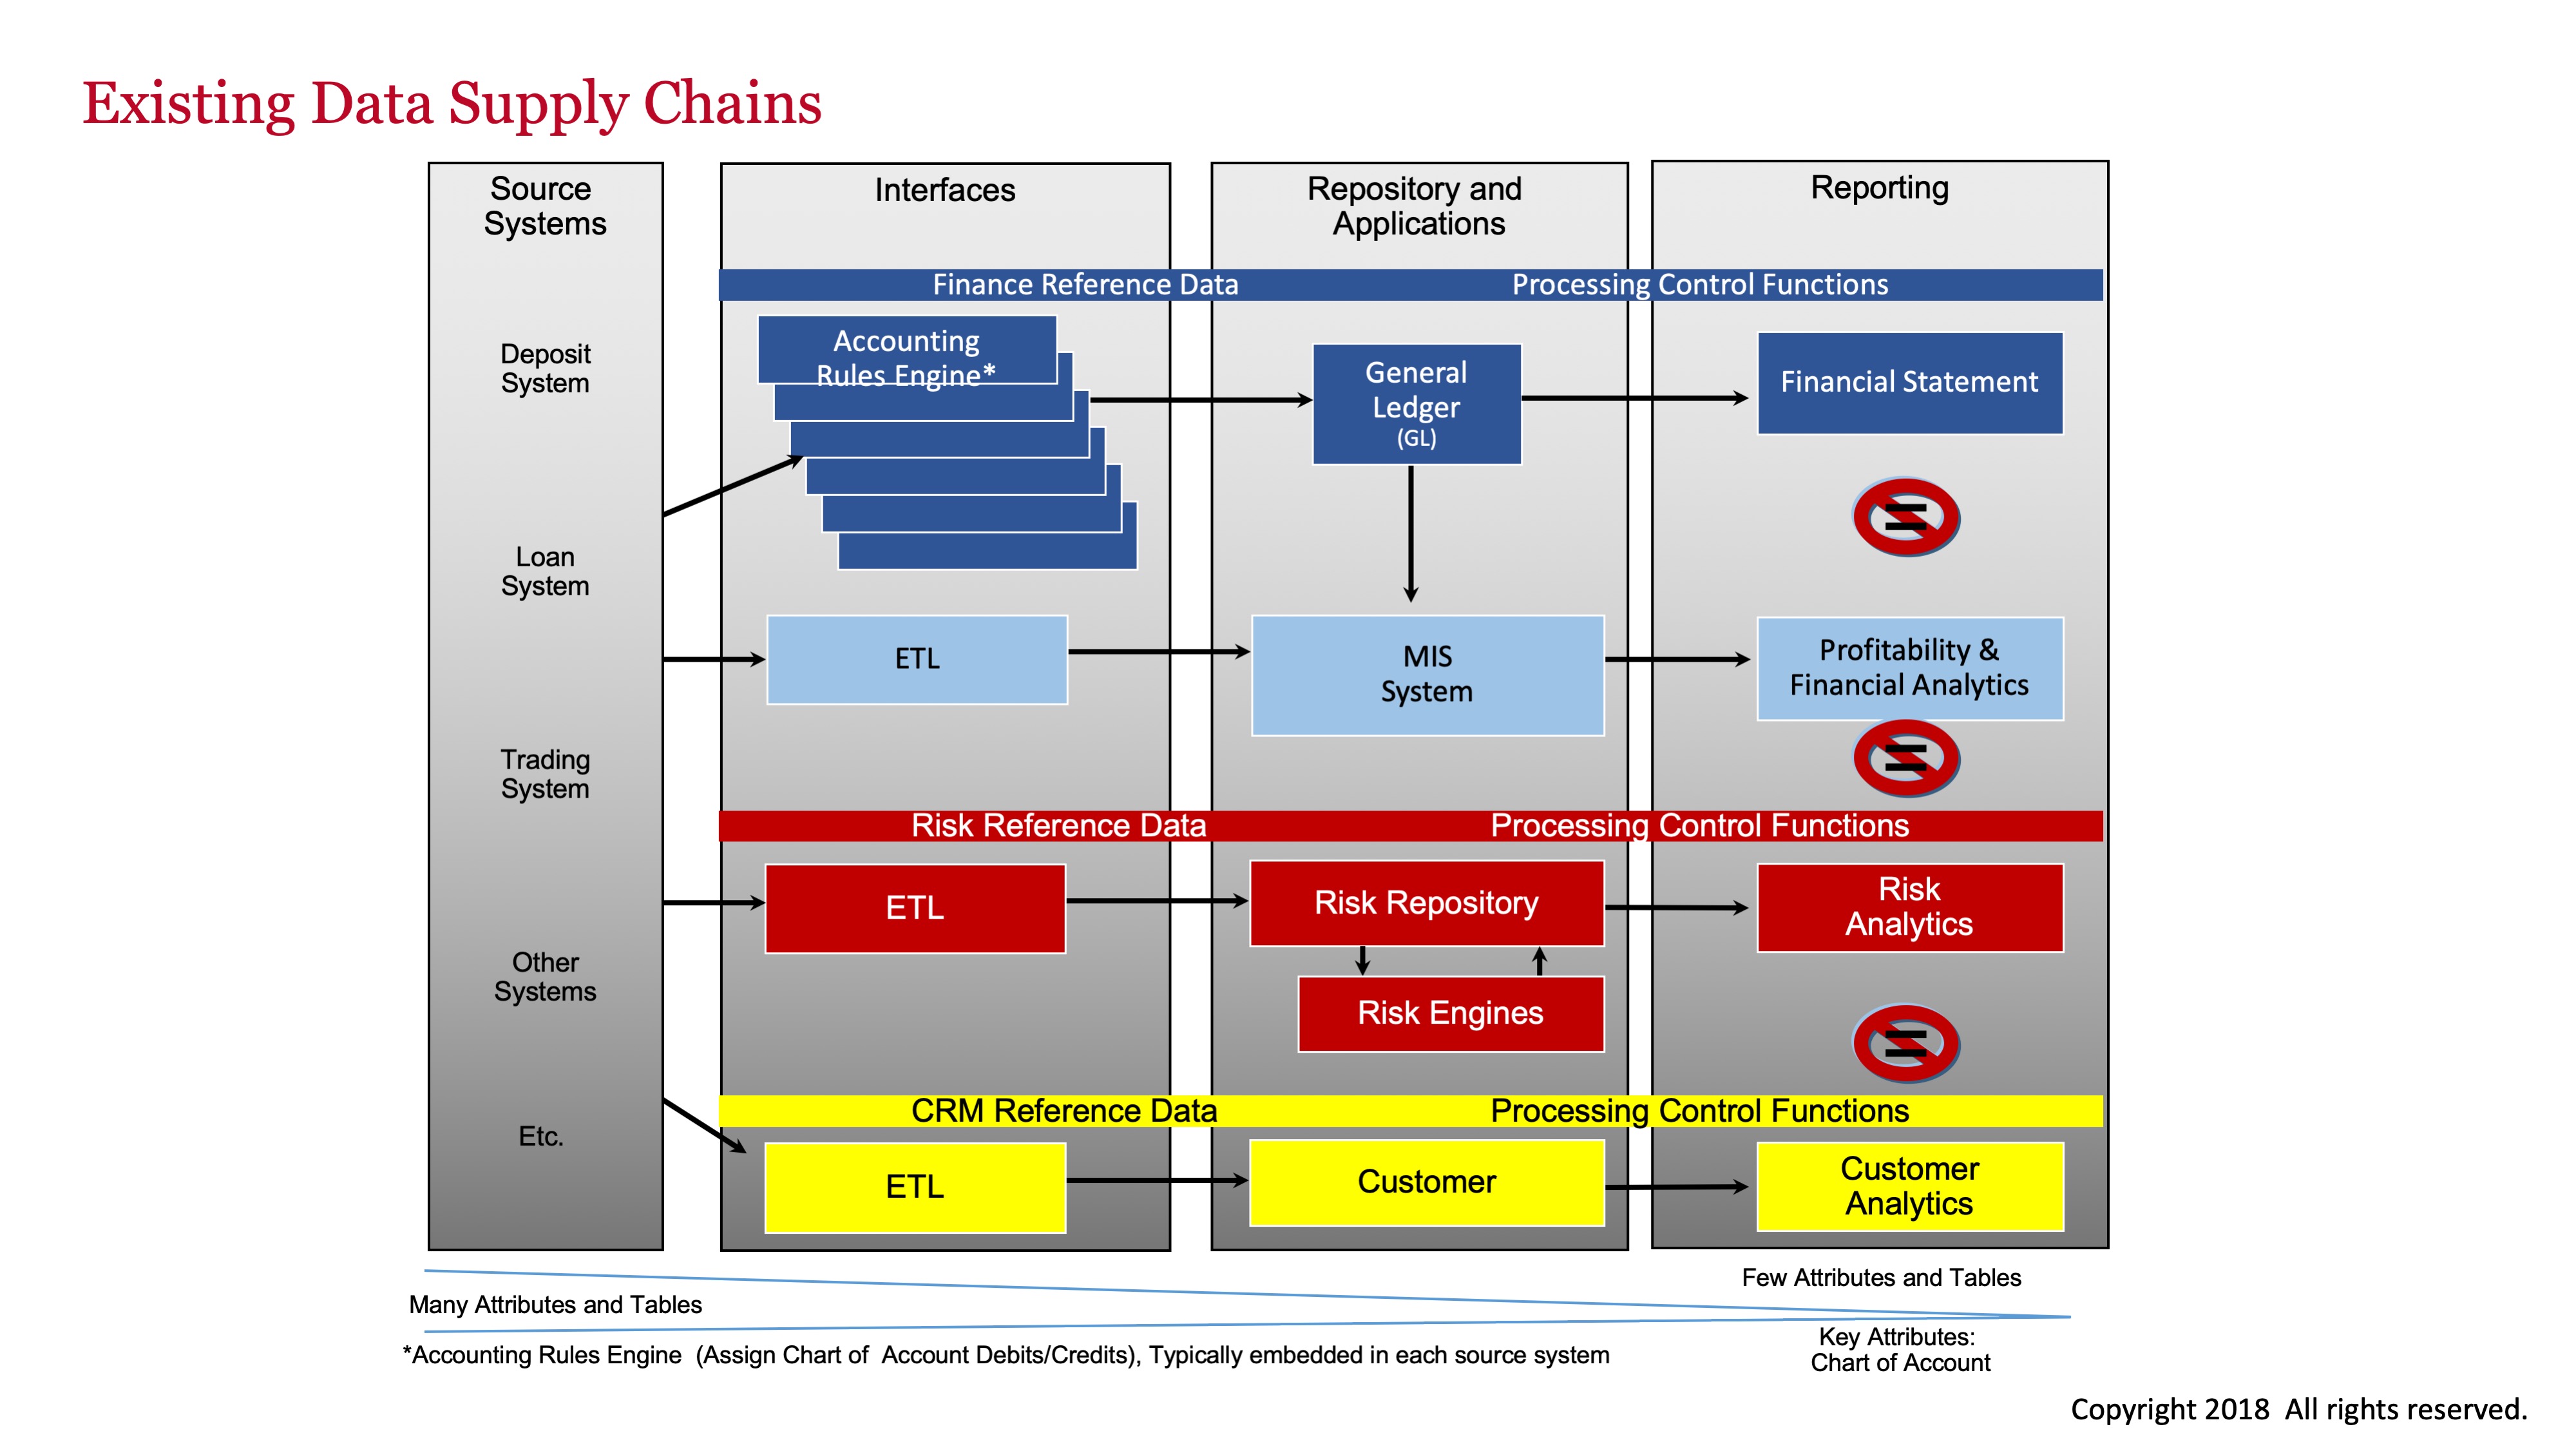
System Architecture Views
The following charts present a couple of different perspectives on finance and risk systems architectures.