
In order to make my vlog and blog more useful, I have started a new video series call Coding with Kip. The format of this series will be more technically focused, and will be a longer format to go more in-depth. The initial videos, four parts, are described here.
Starting in July 2017 I created a very simple financial system proof of concept (POC). The videos inserted in this post show the results of that work. The POC was complete by mid September 2017, so approximately two months.
Objective
The objective of this POC was to strip away all the other processing paradigms and get back to what the simple posting processes looked like, why there were done, and how the were able to scale. It was intended to use simple but more recent technologies to turn transactional data into usable information. Posting processes assist in that journey by creating point in time balances, which give a perspective on what has happened over time in a very efficient manner.
>>> Related Post: Retrospective of a 30 Year Problem <<<
Data Used
The first problem in doing such a POC is finding the appropriate data. As my POC was not sponsored by some organization who might give me real financial data, I worked for months to find publicly available, real data.
As my friend, Dillon Papenfuss quoted me as saying:
“I have never seen system-generated data that has all the variability
of real, live production data. The differences are so stark it is a bit like the difference between a painting of a landscape, and a real, live landscape. The system-generated data is flat; it can give the single image it was intended to produce. But if one walks to the side of the painting, the image is not interesting at all. Whereas if one walks to a different point to view a landscape, it can be just as fascinating and interesting as the original perspective. And one can walk into the landscape, just as one can walk into real production data, and find all sorts of new things within it. System-generated data never has that kind of interest to it.” “Data: the Strategic Asset: November 2019” Financial Education & Research Foundation (FERF)
Adhering to this standard, I came upon the publicly available financial data from the Commonwealth of Virginia. Virginia’s commitment to transparency is remarkable because of the depth and breadth of data they have made available, from 2003 to the present, payment and aggregated tax receipt data, along with descriptive reference files. You can find it on Virginia Data Point. I have also packaged the data for download in my Data World page.
>>> Related Post: Requirements Are In The Data <<<
This video gives an overview of the POC and the results of it.
The overall POC was composed of three parts:
- Really Simple Commerce – A Business to Consumer (B2C) blockchain ledger system for payments and receipts
- Posting – Turning transactions into balances for efficient processing in a universal ledger
- Analysis – A simple financial analysis engine.
The POC description starts with the posting process first, the first component developed.
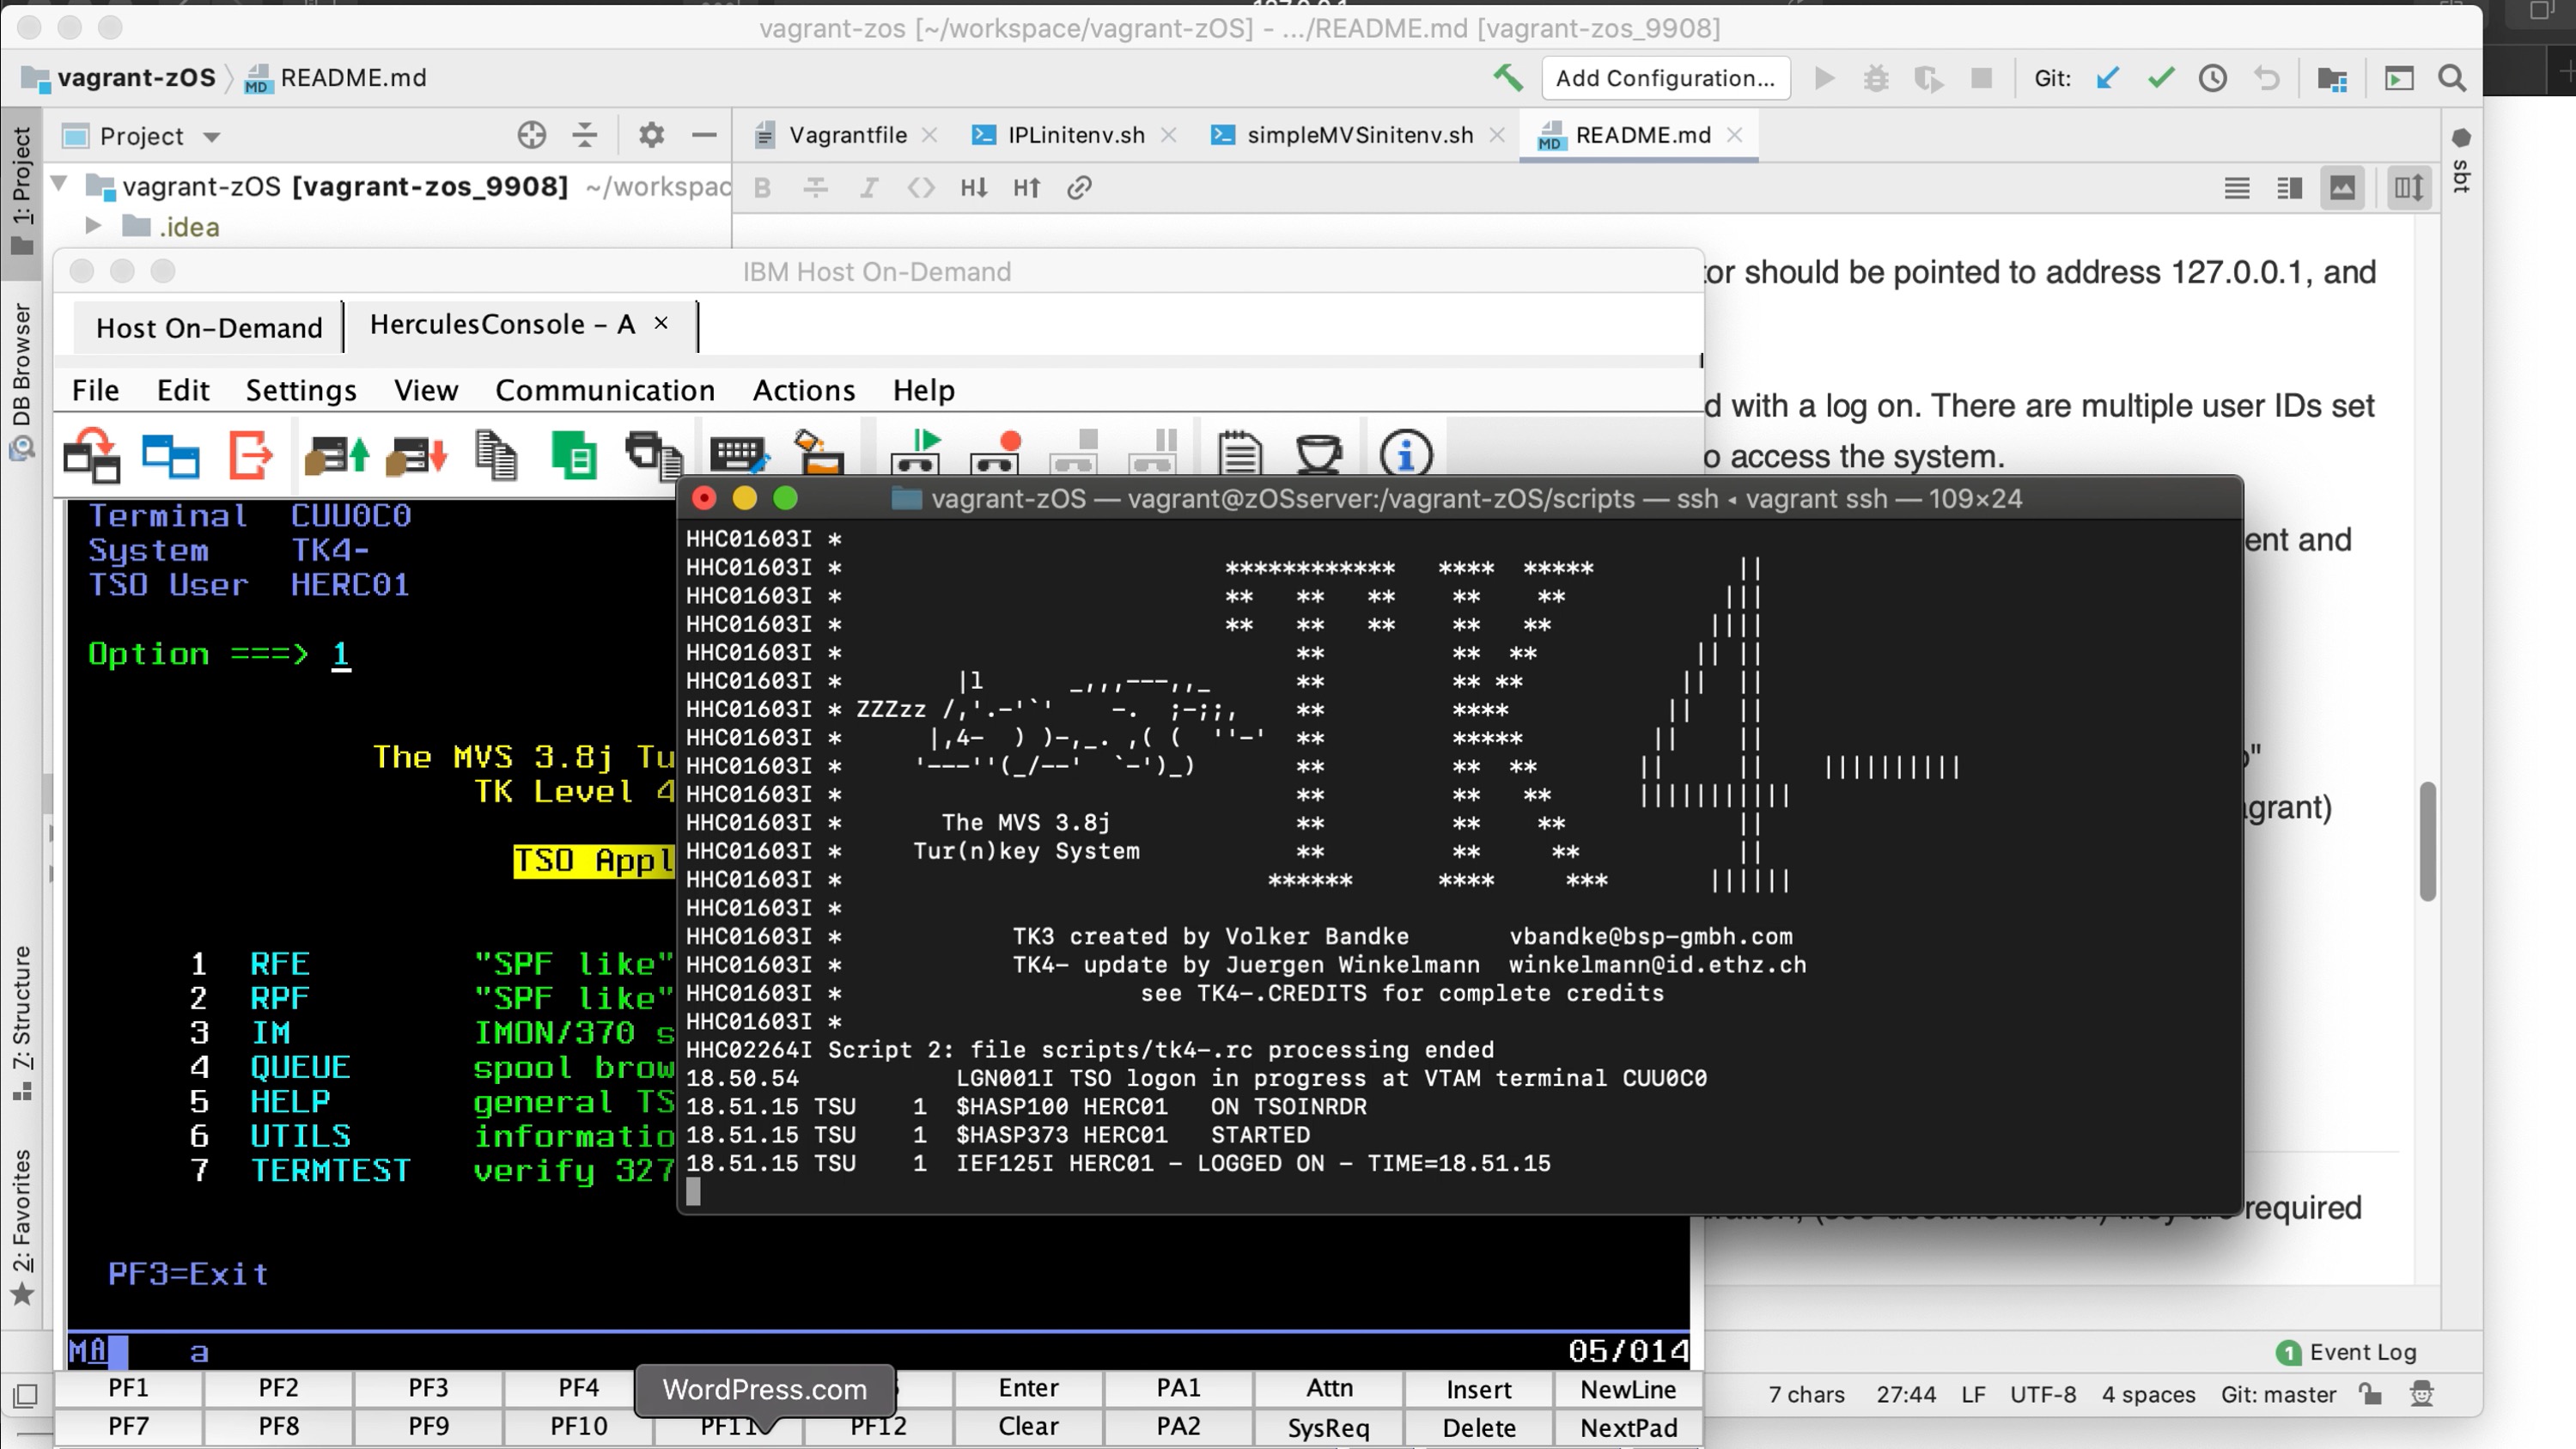
Posting Process

The above diagram gives an overview of the first two parts of the system, the posting and at the very end bottom left, the analysis (discussed below).
The following diagrams give a view of the inputs and outputs from the system:


In brief, the system has two programs: the ID Assignment program, and the Posting program.
>>> Related Post: The Big Idea: Eliminate Posting <<<
ID Assignment
ID Assignment takes in payment and receipt data at a detailed level. The payment data contains a vendor name. The system uses the vendor name to build (as well as possible) a vendor master file, with a unique ID assigned to each Vendor.
It also creates Universal Journals. It does not do double entry accounting rules, a single transaction in creates a single journal out, but with most of the attributes one would expect to see on a journal entry.
It also produces records of changes to the vendor master file. This is needed because the vendor master is maintained in two different sort sequences for efficiencies: one sorted by vendor name (for ID assignment), and the other sorted by ID (for use in the match-merge posting process.
>>> Related Post: Metric Engine and Detailed Identifier <<<
Intermediate Sorts
Between the ID Assignment and the Posting Program, the outputs from the first phase are resorted into ID order. The major master files used in the Posting program are always maintained in ID sorted order. Resorting these master files would take a long time, and the objective of this POC was very efficient processing, both CPU and elapsed time.
Let me emphasize that by restating it. The much larger master files, balances and Vendor Master sorted by Vendor ID, are never resorted, but are read in sorted order, updated and written in sorted order. This is a key processing paradigm from a much earlier period in computing for maximum computing efficiency.
The sorting process on the input transaction records and vendor master update records are always limited in size because the files only contain the data after the last execution of the ID Assignment program.
>>> Related Post: Sorting in Historical Process <<<
Match-Merge Posting Process
The second major program takes in four files: the transactions (in the form of journals), the vendor update records, the vendor master and the balance file.
It outputs two files: The updated vendor master and the updated balances.
To do this, it uses another very old processing paradigm, the match-merge process. In a match-merge process, because the files are maintained in sorted order (and the program should detect and throw an error condition if they are not), each record from each file are evaluated to determine (1) if they match and thus an update should be made to the master file based upon the transaction record, (2) if the transaction record is higher, and thus the prior master record should be finished up and written to the master output file and a new master read (3) or the transaction is lower, and a new master record must be created.
>>> Related Post: Master File Update <<<
The Posting program performed these test twice: (1) once on the Vendor Master with the Vendor Update transaction record, and (2) when working on a particular vendor, doing another loop for all the balances for that vendor, and the associated transactions for each of those balance.
Because the VA data is only released quarterly, and did not have a transaction date on it, only a single quarter for each file named, the program was written to make annual balances. A new file was created each year for balances in that file, rather than putting multiple balances onto a single record for the appropriate key.
Contrast with a General Ledger
Typical general ledgers lose all visibility to customer or, in this case, vendor details. But this POC was to prove that it is possible to keep these details, yet record all the information typically maintained in a General Ledger. Thus instead of a typical tens of thousands of rows General Ledger, this system has twelve million of balances.
But these twelve million balances are still substantially lower in data volumes than the 100 million transactions which composed them.
The power of this approach will be demonstrated in the Analysis Program Section below.
>>> Related Post: GL in the Financial System Architecture <<<
Performance
In order to decrease elapsed time, I divided the input files creating 10 different partitions using the first two characters vendor name. These partitions were not equal in size (they had some lumpiness to them), but it was what capacity I had available to me during the POC timeframe.
I ran the system at full volume on my personal MacBook Pro machine with the following configuration:
- MacBook Pro MacBookPro12,1
- Processor: Intel Core i7, 3.1 GHz, 1 Processor, 2 Cores
- L2 Cache (per Core): 256 KB
- L3 Cache: 4 MB
- Hyper-Threading Technology: Enabled
- Memory: 16 GB
The time to process was:
- Starting time: Sat Sep 9, 2017 03:31:39 UTC 2017
- Ending time: Sat Sep 9, 2017 06:09:43 UTC 2017
- Total time is 2 hours 38 minutes
(A separate run on Wed Sep 6 took 1 hour 28 minutes. I have not analyzed the log files completely, but I believe the work done should be the same.)
In this space the two Posting Programs did the following:
- Read over 432 million records in total
- Wrote over 348 million records in total
- For a grand total workload of over 780 records
- Input transactions from the State of Virginia were over 101 million
- Vendors identified were over 2 million (there are duplicates because of the various ways vendor names are spelled which I only did minimal effort to clean.)
- Total balances produced was over 12 million
- Years of data processed included 2003 to 2016
>>> Related Post: The Daily Financial Cycle <<<
Apache Spark
Note that only the input transactions were partitioned, and once established, the partitioning scheme remained static for all remaining time periods (13 years of quarterly processing).
In my analysis of using Spark as an engine to perform the same features, it was not clear to me how one would instruct Spark to not dynamically repartition the master files before performing the required instructions. There are numerous Spark turning options available, so perhaps I just never got deep enough to find this one.
In a true one pass architecture (which my system was, albeit two different functions were being performed so one pass each, one set of functions on names, the other on IDs), dynamic repartitioning of the master files to more effectively utilize computing resources available at the time is a waste of a pass of the data; the functions to be performed could have been performed in the repartitioning pass and doing so will always result in the lowest compute resource consumption, as an IO pass of the data is avoided.
I would be interested if anyone sees a way around this limitation.
The other limitation I see with Spark is the ability to direct it that the input files are in sorted order by the primary key of any joins. The Posting program, the second in the series, performed a four way join, on the (1) vendor master, (2) vendor master update records, (3) journal entries, (4) and balances. Yet the memory required by the program was very small, as each record needed for the join was either the last record read in the file or missing, in which case it was a not found condition.
I would also be interested if anyone can see a way to accomplish the same thing with Spark.
>>> Related Post: Apache Spark and Data Supply Chains <<<
Posting Video
The following is the video of the posting portion of this POC
Analysis Program
The Analysis Process was intended to show the power of a universal ledger in the following ways: (1) The efficiency of using balances for speed in analytical processes, (2) the types of views typical of a General Ledger, (3) the power of a universal ledger to also show much more granular views as well.
>>> Related Post: Data Supply Chains Defined <<<
Load Process
I modeled my analytical process off an in-memory database to show the greatest speed possible. Because the memory of my laptop was limited to 16 Gig, the program requires one to select a period of time to be loaded in memory to analyze. The program loaded all ID partitions of the data for the chosen time periods.
As the data is loaded, various anticipatory cuts of the data are created, to improve performance. In our analytical processes, we often make these types of tables, but the most often get stored for use. The POC approach taken of working the more granular balances means that these in memory structures never have to be updated; never get out of date; never drift from the more detailed data, and yet are very efficient in use of compute capacities.
The following graphic shows the various cuts created as the data is load.

The center top box is the detailed balances for the chosen period, as produced by the Posting Engine. These balances have most all the attributes of the transaction available, because they are at the vendor/time period level, so they are very close to having all the transactions loaded into memory. A limitation of the POC was that quarterly views cannot be produced, as the balances created are yearly balances.
The box below the center box represents the vendor attributes. All vendors for all periods, all 2.1 million vendors in the vendor master file, are loaded, independent of the time periods chosen for analysis.
The box on the left represents a selection of the top 50 vendors by spend. This table represents a typical area of detailed analysis, those with high levels of interaction with the business. The program makes use of the “one-pass” concepts of high volume analytics by creating this table as the data is loaded, thus avoiding the processing of determining the high value vendors on each query. This table contains 50 total rows.
The box on the right represents an aggregated view of the detailed data. This is something like the typical General Ledger view, which drops the vendor key from the aggregate, but keeps all the other attributes. The few low single digit millions of rows of balances for any year typically collapses in this table to less than 150,000.
>>> Related Post: Reporting Layer in Financial System Arch. <<<
Cuts and Pivots
The following graphics taken from the video give a sense of the functionality of this program.
The first cut of data shown after loading the data into memory is the 50 top vendors by spend or revenue. One could continue to analyze this table if desired. Note that the output shows that 50 records have been used to produced this view.

Next the program is shown displaying cuts of data from the General Ledger like table, the far right table.

This cut shows aggregated views, like legal entity, nominal account, product or project views.
The program also allows one to produce these same views using the detailed balances. The response time is similar to doing them off the summary structure. So in a sense, one might ask the question why is the far right table needed? The answer, in today’s computing world is that it may not be! Our General Ledgers were architected decades ago, and with today’s compute environments, we might not need them if we managed the detail data in line with their required views.
This last screen shows the power of a universal ledger. In this view, we analyze detailed vendors, producing aggregated views, but with additional attributes on them.

In this POC, I did not have any additional vendor attributes available to me to place on the Vendor master besides vendor name, with the exception of one: whether that vendor came from an Expense or a Revenue file (in the case of Revenue, it is not really a vendor, and in fact I simply reused the Agency Name as a vendor, in order to demonstrate the capabilities).
What this analysis shows is that it is possible to produce a view of the data that very efficiently joins the detailed balances with the vendor master table.
As I noted in the video, it’s like producing a pivot table in Excel upon a tab of 1 million balances, where the column of vendor type is a vlookup function to another tab of the 2.1 million vendors, and having the response come back nearly instantaneously.
>>> Related Video: Instrument IDs in Next Gen. Platform <<<
Performance
The performance of this module could be improved, because I used strings for all the data elements, which in java is a real inefficient memory structure to be used. A more efficient in memory representation would have allowed more data to be loaded for use in analysis.
This POC obviously did not consider use of database structures for doing the analysis, which would provide a broader set of analytical views, but at the cost of the database access overhead.
>>> Related Post: Balances are the Inventory of Finance <<<
Analysis Video
Really Simple Commerce
The final module in the POC moved to the transaction processing side of financial systems. This module did not utilize the Virginia data in any way, but rather represented an approach to capturing those transactions, but going far beyond any of the current systems which do that.
The POC simulates three cell phones and a server: (1) an authorizer, (2) a consumer, (3) and a store owner. It combines payment, shared ledgers, democratization of credit creation, social network, and may ultimately extend to virtual currencies. The transaction capture outputs from such a system would be posted into a universal ledger, that would provide the on-going control for the members of the community.
Because it goes so much further than the items published above, I’m going to let the video do the talking about this part of the system:
Additional videos that help explain the implications of this POC can be found in this Conversation with Kip Playlist.
Source Code
The source code for this POC can be found on GitHub VAPostAnalysisRSCDemo. This code is not maintained and is intended for educational purposes only. It is released by IBM under Apache 2.0 License.

[…] Pro. The data used in this demo was the transaction and vendor master files produced as part of the Posting Process POC written in Scala. The source code for the demo is available on GitHub VAPostAnalysisRSCDemo. (This code is not […]
[…] my professional blog, I noted that generated data used in financial systems tend to be one dimensional, like a painted […]
[…] I applaud the makers of the Raspberry Pi, and would like to see a similarly successful effort in the space of smart phones, to enable a radically new type of financial system, as described in this blog entry about Really Simple Commerce. […]
[…] Related Post: Simple Financial System Proof of Concept […]
[…] of the initial discussions focused on two points in Kip ‘svlog post about a prototype system he built, a portion of which is called Really Simple […]